COVID-19: The Chain Ladder Method for estimating deaths not yet reported.
Stavros Christofides, Jason Oke, Carl Heneghan
NHS England releases daily, the number of deaths reported in Hospitals. Most of these reported deaths occurred in the previous week but some occurred more than a week ago – in some cases a month can elapse before they are reported.
This means that the counts of deaths are always an underestimate of the number of people who have died up to date of reporting. The difference between what the final estimate will be on any given date and the current figure can be defined as the deaths that have Occurred but not yet Reported (OBNR). This could be a useful measure in monitoring the ongoing pandemic as well as providing a better indication of recent trends.
The OBNR can be estimated using a technique called the Chain Ladder. This is used by actuaries to estimate incurred but not reported claims by using patterns of past claims.
The principle behind the Chain Ladder method is to use the way in which the counts have accumulated in the past to predict how they will be reported in the future and to fill in the missing (future) values.
The Chain Ladder method:
Arrange the cumulative counts of death by date of death in a spreadsheet, with rows corresponding to the date of death, and the delay (in days) in reporting for the columns. Table 1 shows the top right-hand corner of such a spreadsheet. The cells represent the total number of deaths reported for a specific date for 1 to 30 days later.
For example, the count of deaths on the 1st April and reported by the 26th April was 594 (top left-hand corner). On the 27th April, this number had increased by 2, and by 2 again on the 28th etc. By the 30th April, the total figure for deaths reported as having occurred on the 1st April was 602.
Table 1: Top right-hand corner of the Chain-ladder spreadsheet.
|
Delay in reporting |
| Date of Death |
26 |
27 |
28 |
29 |
30 |
| 1st April |
594 |
596 |
598 |
601 |
602 |
| 2nd April |
600 |
601 |
602 |
603 |
? |
| 3rd April |
656 |
659 |
660 |
? |
? |
| 4th April |
765 |
766 |
? |
? |
? |
| 5th April |
727 |
? |
? |
? |
? |
We can see that the number of deaths for the 1st April after 30 days (602) is higher than the cumulative total based after day 29 (601) by a factor of (602/601 = 1.00017 or 0.17%). We could use this information to “inflate” the estimate for the 30-day delay count for the 2nd April number.
However, the count after 30 days (602) is also probably an underestimate because in rare cases the delay in reporting can exceed a month. We should anticipate this number will also eventually be higher than the current figure. For simplicity, based roughly on the observed numbers of such cases, we have assumed this inflation factor to be 0.8% for all days > 30. If follows then, that the day 29 inflation factor should be 0.8% * 0.17% = 1.0%. This is the chain in the Chain Ladder method.
Starting from the right-hand corner of the spreadsheet we create a cumulative inflation factor in a chain all the way through to the left-hand side of the sheet. The table shows how these calculations would look for the first five days of April.
Table 2. Worked example of the Chain Ladder method.
|
Delay in reporting |
| Date of Death |
26 |
27 |
28 |
29 |
30 |
| 1st April |
594 |
596 |
598 |
601 |
602 |
| 2nd April |
600 |
601 |
602 |
603 |
|
| 3rd April |
656 |
659 |
660 |
|
|
| 4th April |
765 |
766 |
|
|
|
| 5th April |
727 |
|
|
|
|
|
|
|
|
|
|
| Sum (all days except current day) |
2615 |
1856 |
598 + 602 = 1200 |
601 |
602 |
| Sum of previous day |
2622 |
1860 |
601 + 603 = 1204 |
602 |
|
| Inflation Factor |
0.3% |
0.2% |
0.3% |
602/601 = 0.2% |
0.8% |
| Cumulative inflation factor |
1.8% |
1.6% |
1.3% |
0.2% * 0.8% = 1.0% |
0.8% |
| Ultimate estimate |
740 |
778 |
669 |
603.5 * 1.01 = 609 |
602 * 1.008 = 607 |
| Number not yet reported |
13 |
12 |
9 |
6 |
607 – 602 = 5 |
Occurred but not reported (OBNR)
We have projected COVID-19 Deaths in English Hospitals for the whole month of April 2020 using the Chain Ladder method (see figure 1).
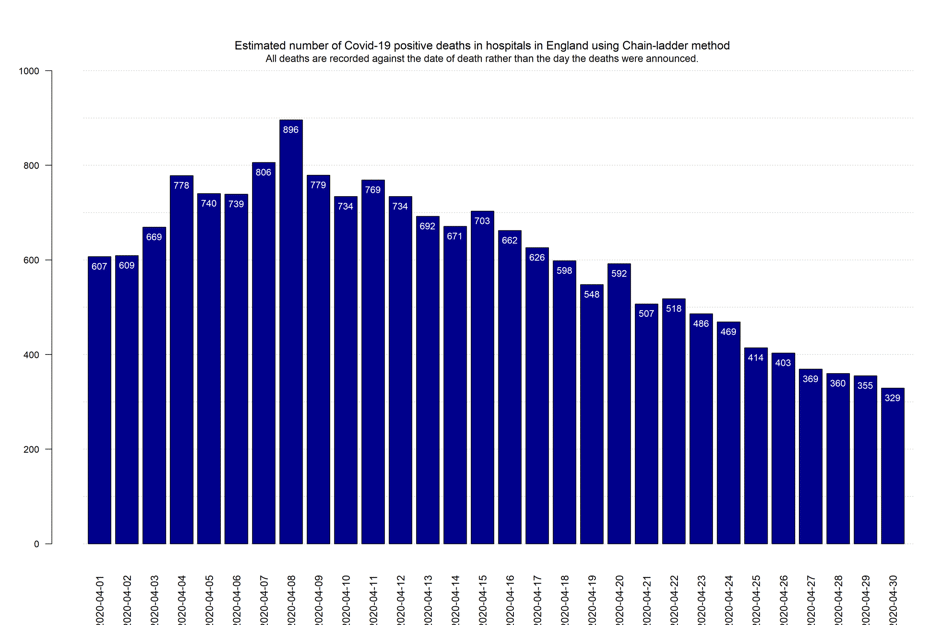
The latest estimate of cases in the reporting pipeline is now just below 1,500 deaths with the standard error of around 120 deaths. Based on a stochastic version of the Chain Ladder using Bootstrap resampling (England & Verrall 1999) the upper bound of the 90% confidence interval for the OBNR is around 1,650 deaths. As the results clearly indicate, with a consistent reduction in ultimate daily hospital deaths the OBNR figure is expected to decrease further. In anticipation of this, we intend to update this analysis once a week.
Uncertainty estimates
As mentioned above we used a non-parametric bootstrap technique (England & Verrall) to get an estimate also of the reliability of the most recent days. Table 3 shows the mean OBNR over all bootstrap samples, with standard errors and the upper bound of the 90% confidence interval estimated from the percentiles of the bootstrap samples for the last five days of April.
As we would expect there is greater uncertainty around the most recent estimates.
| Date of Death |
Mean OBNR |
Standard error |
Ultimate or final number of deaths |
Upper bound of 90% confidence interval for final estimate |
| 26th April |
58 |
19 |
404 |
438 |
| 27th April |
67 |
21 |
370 |
408 |
| 28th April |
84 |
23 |
359 |
400 |
| 29th April |
125 |
33 |
351 |
410 |
| 30th April |
258 |
71 |
328 |
454 |
Limitations
The underlying assumption is that the reporting pattern is stable over time and the existing history can be used to estimate this pattern and “populate” the table. There is no allowance for any changes in the reporting pattern in these calculations.
We have also not made any allowance for day effects such as the fact that registrars offices are closed on Saturday/Sunday and deaths occurring on these days are subject to reporting delays. In addition, we have not accounted for the changes in the rules surrounding the completion of the death certificate following the Coronavirus Act 2020 (see here).
For the uncertainty estimates for specific days we have assumed that the reporting pattern over the last ten or so days is consistent over this period and changes may have a significant impact on these projections. Patterns for COVID-19 Deaths in Care Homes and in the Community may well have different patterns of reporting and the same applies for deaths in Wales, Scotland and Northern Ireland.
Conclusion.
The most recent days estimates now show a consistent pattern and the number of late reported cases are reducing as the overall volumes of daily deaths have reduced at least in these hospitals. Using this method, the upward trend to the peak of the 8th April is just under 38 deaths per day and the daily reduction since then is a fairly steady drop of just over 23 cases per day. Our finding suggests that deaths occurring in April will continue to be reported in May and add to the number of deaths already recorded from the pandemic.
References
England,P.D. & Verrall,R.J.(1999).Analytic and bootstrap estimates of prediction errors in claims reserving Insurance : Mathematics and Economics,25,281-293.
Acknowledgements.
With thanks to Richard Kelsey for commenting on the manuscript.