Measuring vaccine efficacy from population data
October 25, 2021
The Office for National Statistics (ONS) published a report based on an analysis of deaths involving COVID-19 that occurred between 2 January and 2 July 2021 in England, by vaccination status.
Table 1 showed the number of deaths involving COVID-19 by vaccination status sub-divided into five groups; 1) unvaccinated, 2) received only the first dose and died within 21 days of vaccination, 3) received only the first dose and died 21 days or more after vaccination, 4) received the second dose and died within 21 days of the second vaccination, 5) received the second dose and died 21 days or more after the second vaccination.
A threshold of 21 days is used because of the delay in building immunity.
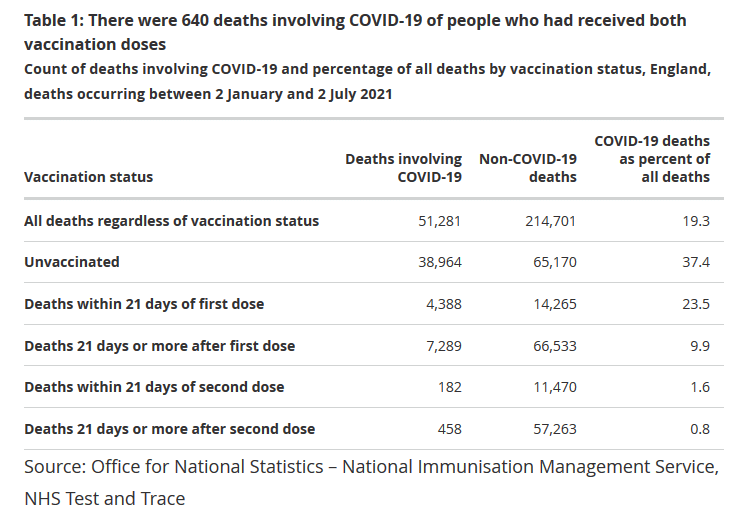
From this table, it is tempting to conclude that a much larger percentage of deaths (37.4%) in the unvaccinated group are from COVID-19 compared to the fully vaccinated group, where COVID-19 deaths make up less than 1% – which is a stunning difference whichever way you look at it. Surely such a difference is overwhelming evidence of the benefit of the COVID-19 vaccine?
There is, however, a potential problem, which is not immediately apparent.
With any observational comparison, the groups being compared are likely to differ with respect to relevant prognostic factors (e.g., age, socio-economic status, health status).
Often the effect of these differences can be small and not large enough to obscure the actual effect we are interested in. Yet, sometimes a confounding factor can dominate and produce substantial bias in the reported estimate. And in this case, the hidden confounder is the time period and the fluctuation in COVID-19 risk.
At the start of 2021, most people were not vaccinated and therefore eligible for the “unvaccinated” group. The beginning of the year was also when COVID-19 made up a large proportion of deaths ( ~ 40%). As time went on, the proportion of unvaccinated decreased. See table 2.
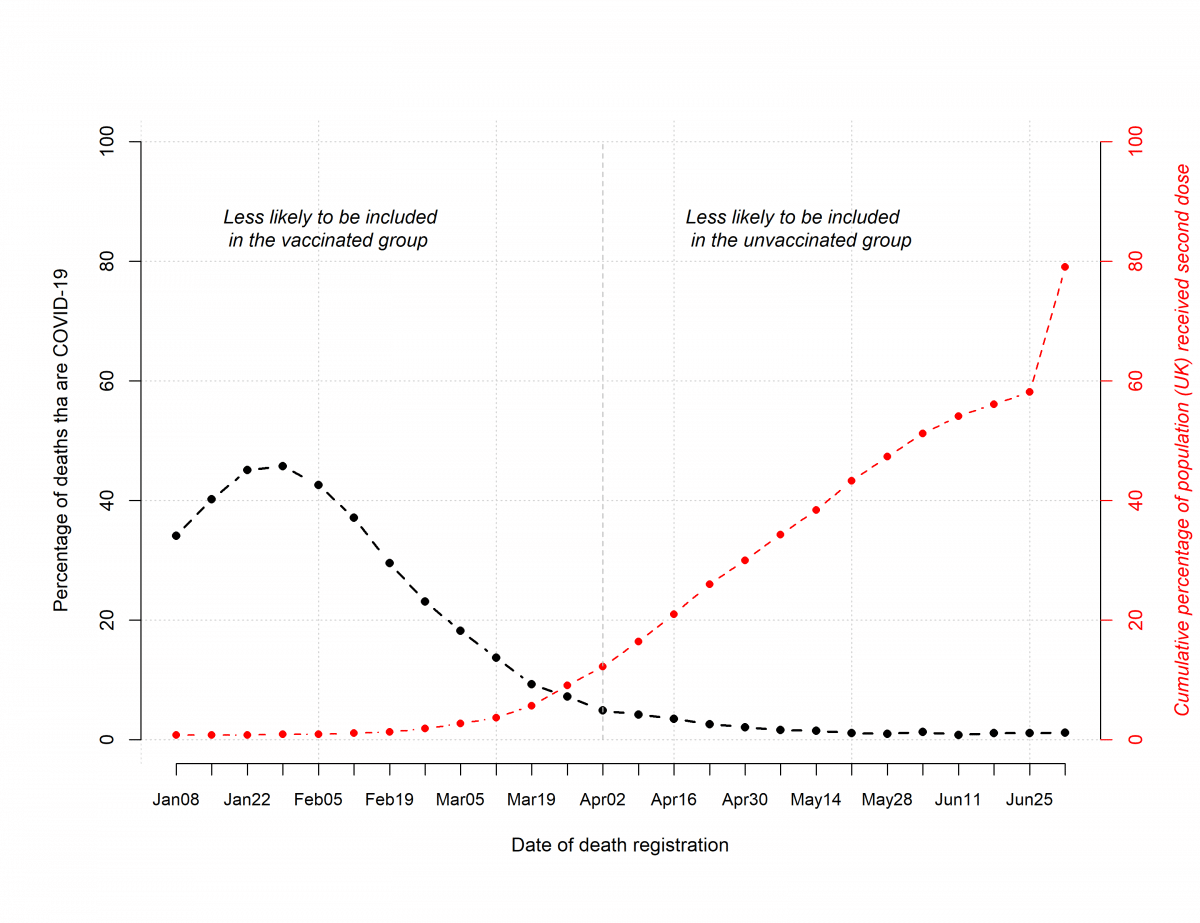
Figure 1: Percentage of deaths by week that are COVID-19 (ONS data) and cumulative percentage of the population that has received second vaccine dose.
The opposite is true for the vaccinated groups, especially in the second dose groups. There were very few eligible early on when death rates were higher.
For example, even by the 6th of April, only 10% of the UK population had received a second dose (data from https://coronavirus.data.gov.uk/details/vaccinations). As time went on, the number in the vaccinated groups increased as COVID-19 risk fell.
Hence, a direct comparison of COVID-19 deaths as a percentage of all deaths is a mixture of the actual vaccine effect and the biases due to confounding by time period and COVID-19 risk. Even if the vaccine were ineffective, a comparison of two such groups confounded by time would still produce a large “effect”. An analysis can account for the seasonal impact when deaths occur by comparing similar periods from previous years (although this is still not perfect).
Conclusion.
Measuring the effects of vaccines using population data is not straightforward. It can produce misleading results and inherent biases, which are difficult to spot, particularly if an important confounder such as the seasonal effect is overlooked.
Authored by Jason Oke and Carl Heneghan