COVID-19: Declining Admissions to Intensive Care Units
June 29, 2020
Daniel Howdon, Jason Oke, Carl Heneghan
In a recent article, we observed an apparent fall in the in-hospital mortality rate since the start of the COVID-19 epidemic in the UK and called for an investigation into which, if any, of several plausible reasons contributed to explaining this.
A similar pattern can be observed with regard to intensive care patients.
This article uses data from the weekly Intensive Care National Audit and Research Centre (ICNARC) report on patients in intensive care (at time of writing, most recently published on 26 June, and the slides published on gov.uk as a legacy of the end of the daily press conference briefings (at time of writing, also most recently published on 26 June)
As ICNARC include only data from England, Northern Ireland and Wales, we use only these three constituent countries of the UK in this analysis.
We make three observations from these data and again call for an investigation into which potential mechanisms may explain this.
- The ratio of daily patients admitted to ICU to daily patients admitted to hospital has fallen substantially.
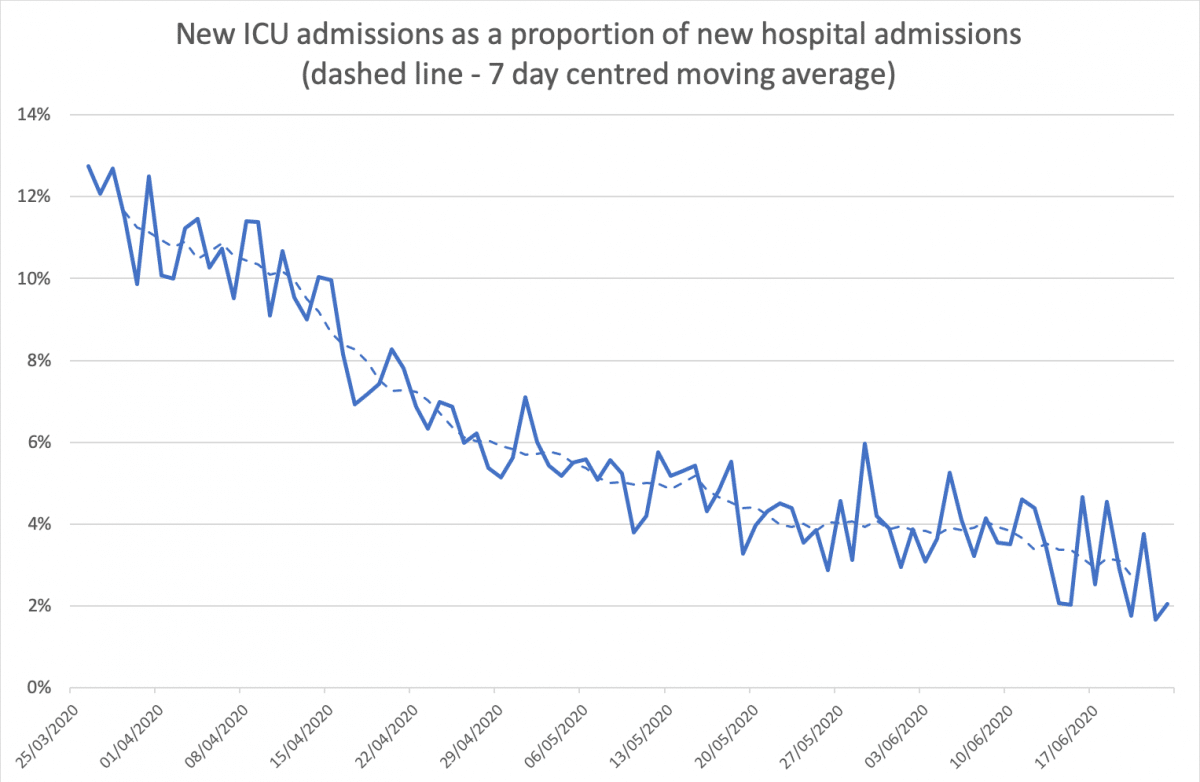
Source: new patients in ICU (ICNARC), new hospital admissions (gov.uk dataset).
Data for the last week should be seen as potentially unreliable, but the series otherwise exhibits a large fall from around 12% in late March (the start of consistent reporting of this data series) to flatlining at 4% by mid-late May. Although recent trends in data series should be handled with caution, data points since early June are suggestive of possible further falls.
More severely unwell patients may be more likely to be both tested and admitted to ICU. This could explain some of the fall in the proportion of patients admitted to ICU if there was more restricted availability of in-hospital testing at the start of the UK epidemic.
This could also operate through the increased testing of patients in-hospital irrespective of whether they exhibit COVID-19 symptoms, as such people appear in figures as COVID-19 patients in hospital irrespective of the reason for their admission.
- The ratio of total patients on mechanical ventilators to total patients in ICU has fallen substantially.
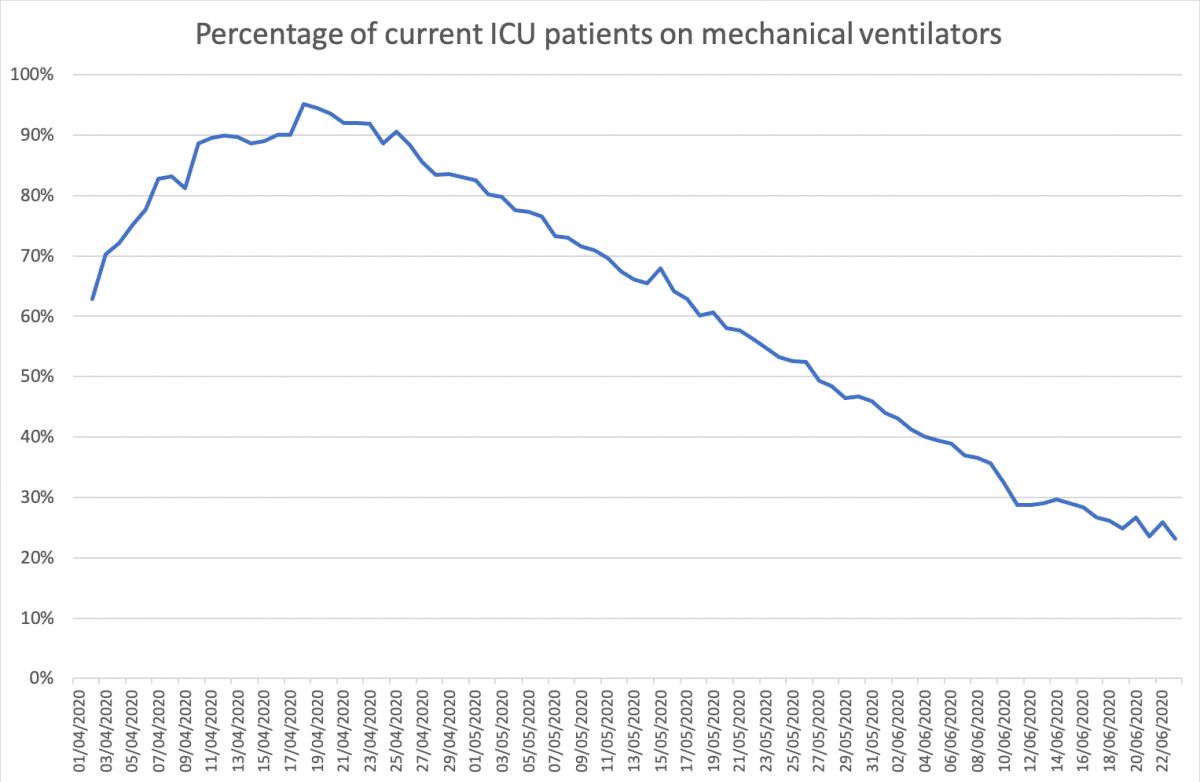
Source: patients currently in ICU (ICNARC), patients currently on mechanical ventilators (gov.uk dataset).
This series again exhibits a large fall from around 90% in mid-April to around 30% by mid-June.
- The proportion of patients leaving ICU alive has risen substantially.
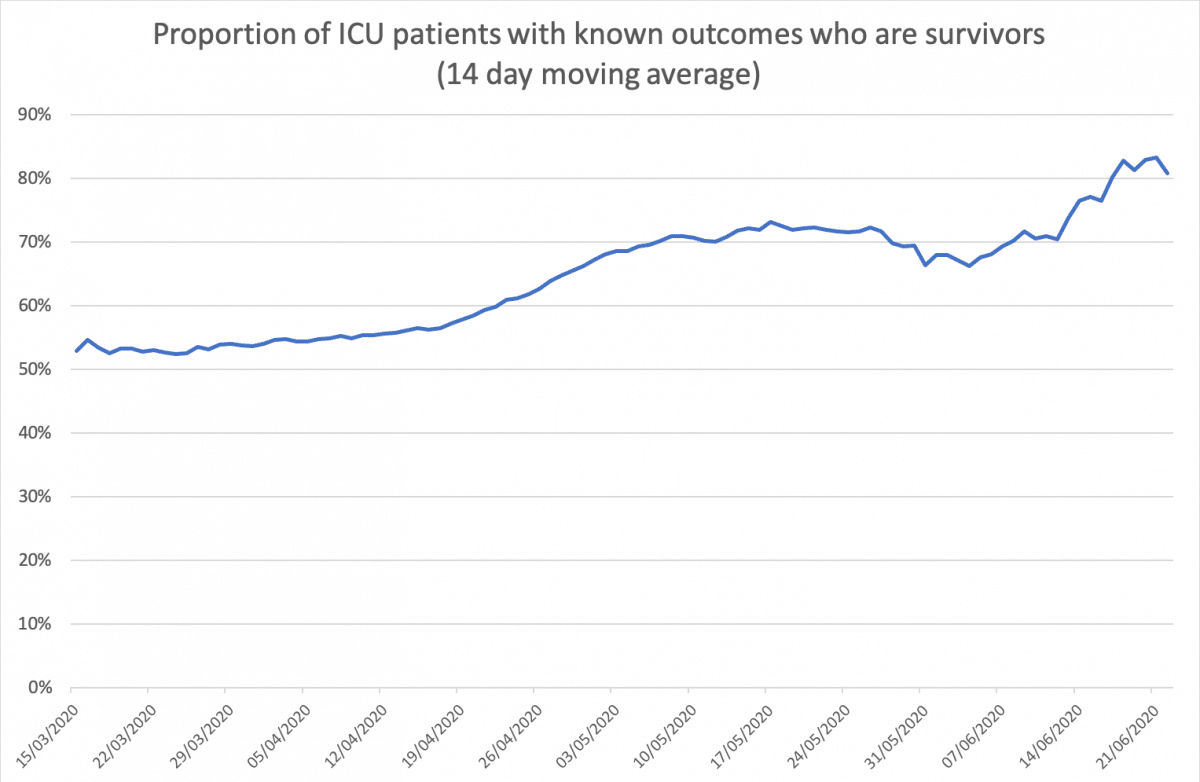
Source: outcomes from ICU patients (ICNARC).
This series exhibits a strong upward trend from 50 to 55% in the first few weeks of the series to around 70% by early May. While the usual caveats regarding more recent data again apply, it appears that survival may have continued to rise further more recently.
This does not appear to be an age composition effect, as shown by data below stratifying survival by age group for each of the earliest and latest groups of just under 3,000 patients to have survival reported. These data show that while older age groups face greater in-ICU mortality risk at both time points, appreciable and statistically significant increases in survival are observed for all groups below the age of 80.
Table 1: survival of ICU patients with a reported outcome as of ICNARC report 17th April (n=2,935).
| Age group |
Survivors |
Decedents |
Survival |
| 16-39 |
176 |
50 |
77.9% |
| 40-49 |
235 |
85 |
73.4% |
| 50-59 |
388 |
285 |
57.7% |
| 60-69 |
366 |
494 |
42.6% |
| 70-79 |
221 |
482 |
31.4% |
| 80+ |
50 |
103 |
32.7% |
Table 2: survival of ICU patients with an outcome reported between ICNARC reports 15th May and 26th June (n=2,647).
| Age group |
Survivors |
Decedents |
Survival |
| 16-39 |
196 |
16 |
92.5% |
| 40-49 |
328 |
66 |
83.2% |
| 50-59 |
588 |
172 |
77.4% |
| 60-69 |
515 |
257 |
66.7% |
| 70-79 |
237 |
189 |
55.6% |
| 80+ |
38 |
45 |
45.8% |
Table 3: Change in the survival of ICU patients with an outcome reported between ICNARC reports 15th May and 16th June (n=2,647) and ICNARC report 17th April (n=2,935).
| Age group |
Survival (to 17/04) |
Survival
(15/05 to 26/06) |
Change |
p value |
| 16-39 |
77.9% |
92.5% |
+14.6 |
<0.001 |
| 40-49 |
73.4% |
83.2% |
+9.8 |
0.005 |
| 50-59 |
57.7% |
77.4% |
+19.7 |
<0.001 |
| 60-69 |
42.6% |
66.7% |
+24.2 |
<0.001 |
| 70-79 |
31.4% |
55.6% |
+24.2 |
<0.001 |
| 80+ |
32.7% |
45.8% |
+13.1 |
0.111 |
Date of outcome is not deterministically and uniformly linked to the date of admission. ICNARC point to generally better outcomes for patients with a longer stay in ICU. Part of this effect is likely to be reflecting that reports based on earlier data inherently capture patients with a more compressed distribution of length of stay, distributed around a shorter average, than reports based on later data.
The overall consistent picture across these measures points to apparent better-recorded outcomes for patients. Attention should be paid to the specific caveats we attach to these series – and there are undoubtedly more to place on them given that these observations are based on aggregates from administrative data. Nevertheless, these trends are striking and require explanation.
Daniel Howdon is a Researcher, Health Economics, LIHS UCU Department Representative, Academic Unit of Health Economics, University of Leeds. Bio here
Carl Heneghan is Professor of Evidence-Based Medicine, Director of the Centre for Evidence-Based Medicine and Director of Studies for the Evidence-Based Health Care Programme. (Full bio and disclosure statement here)
Jason Oke is a Senior Statistician at the Nuffield Department of Primary Care Health Sciences and Module Coordinator for Statistical Computing with R and Stata (EBHC Med Stats), and Introduction to Statistics for Health Care Research (EBHC), as part of the Evidence-Based Health Care Programme.
Disclaimer: the article has not been peer-reviewed; it should not replace individual clinical judgement, and the sources cited should be checked. The views expressed in this commentary represent the views of the authors and not necessarily those of the host institution, the NHS, the NIHR, or the Department of Health and Social Care. The views are not a substitute for professional medical advice.