COVID-19 Mortality Over Time – ONS Update 2nd June
June 2, 2020
Jason Oke, Carl Heneghan.
We are tracking the ONS data on deaths, which updates every Tuesday.
How can we tell if COVID-19 is the principal cause of these deaths? Or if they would have occurred in the absence of COVID-19, particularly in the elderly and people with chronic health problems? One way is to examine the death rates and determine if more people are dying than we would expect. What we want to know is whether the reported COVID deaths represent an “excess” over the norm. (see the ONS report for this week here).
The weekly number of registered deaths for all ages.
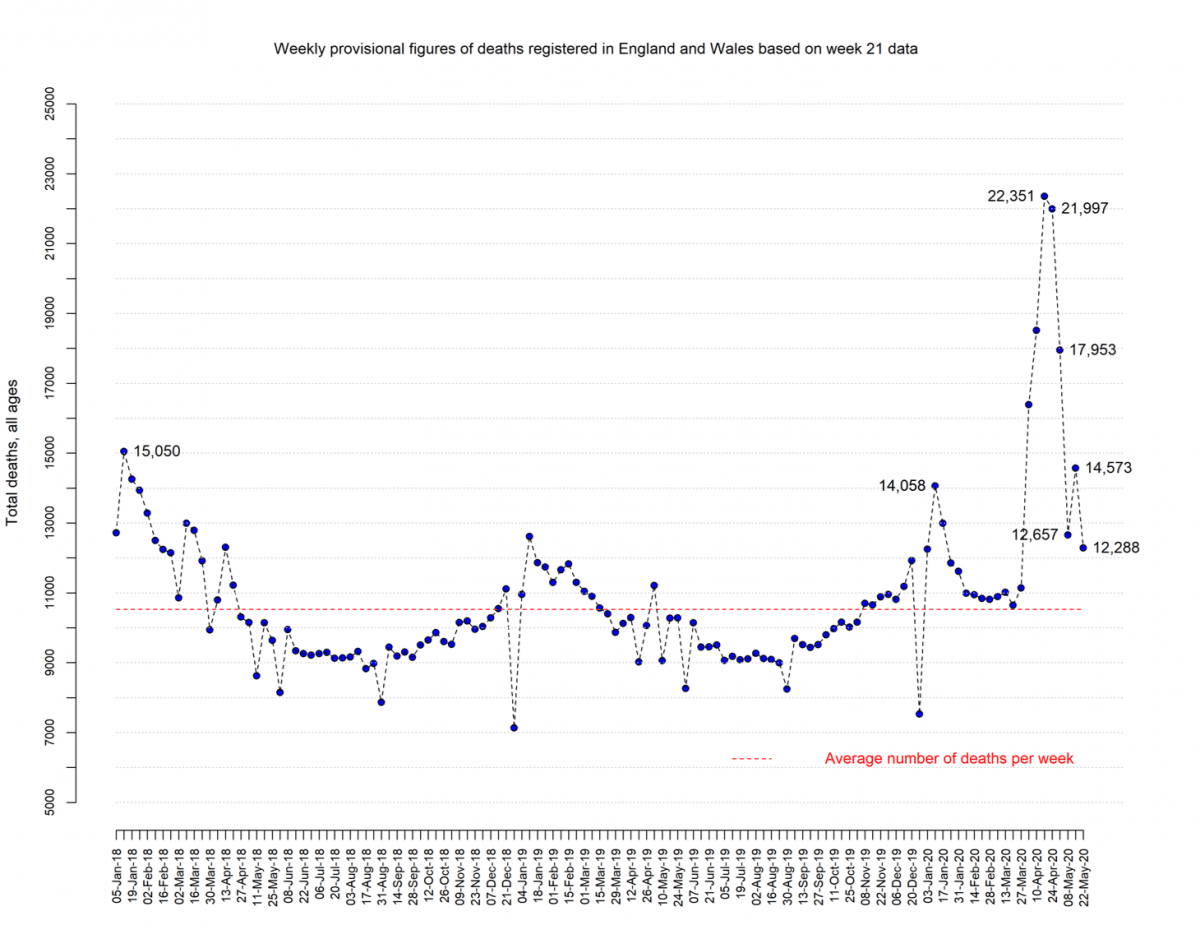
Update June 2nd: today’s data release refers to the week ending the 22nd May (week 21)
- Total deaths all ages 12,288 deaths.
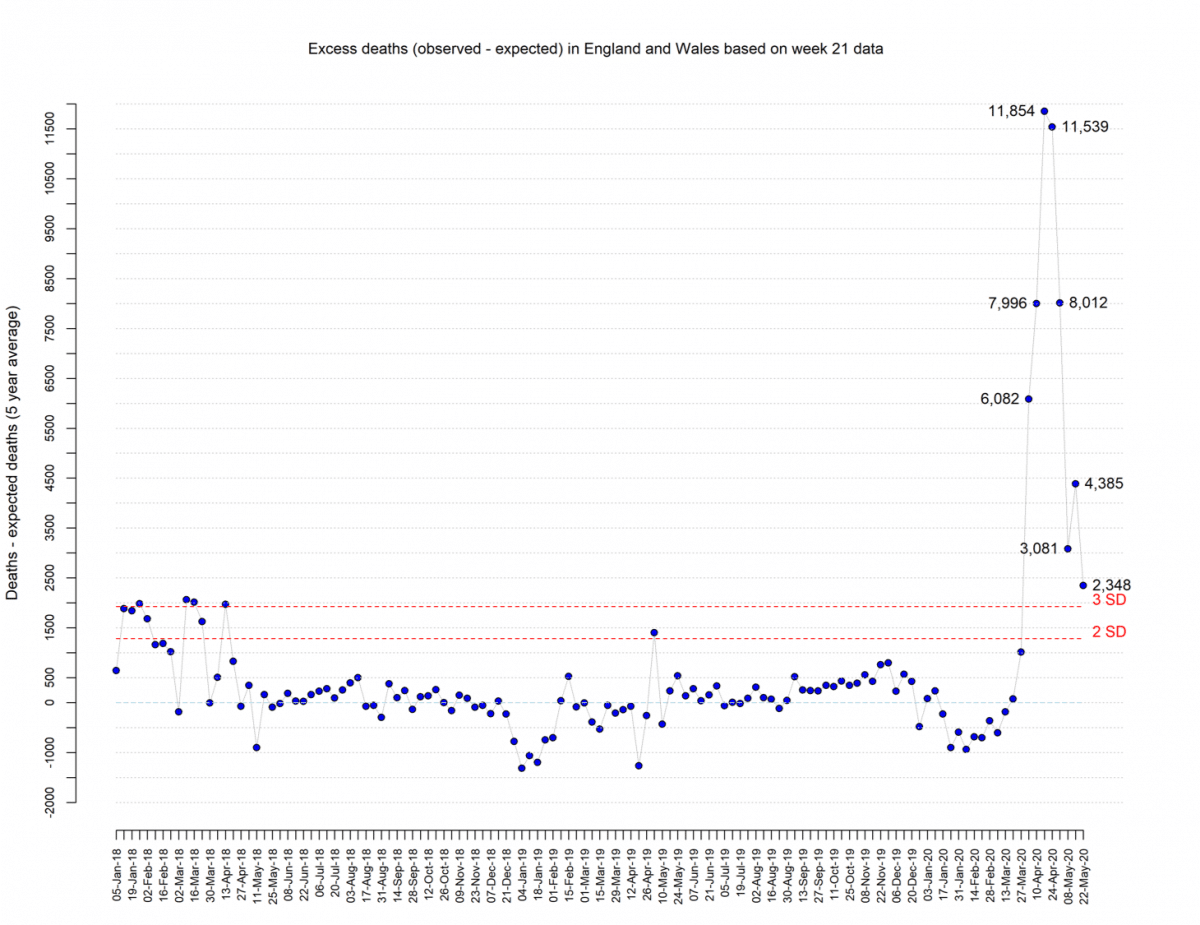
- Thus is an excess of 2,348 deaths compared with the five year average for this week (23%) more than we’d expect in this week (5-year average 9,940); relative risk: 1.23 (1.20 to 1.27).
By looking at previous years we observe variation from year to year in the number of deaths and also there is an increasing trend over time.
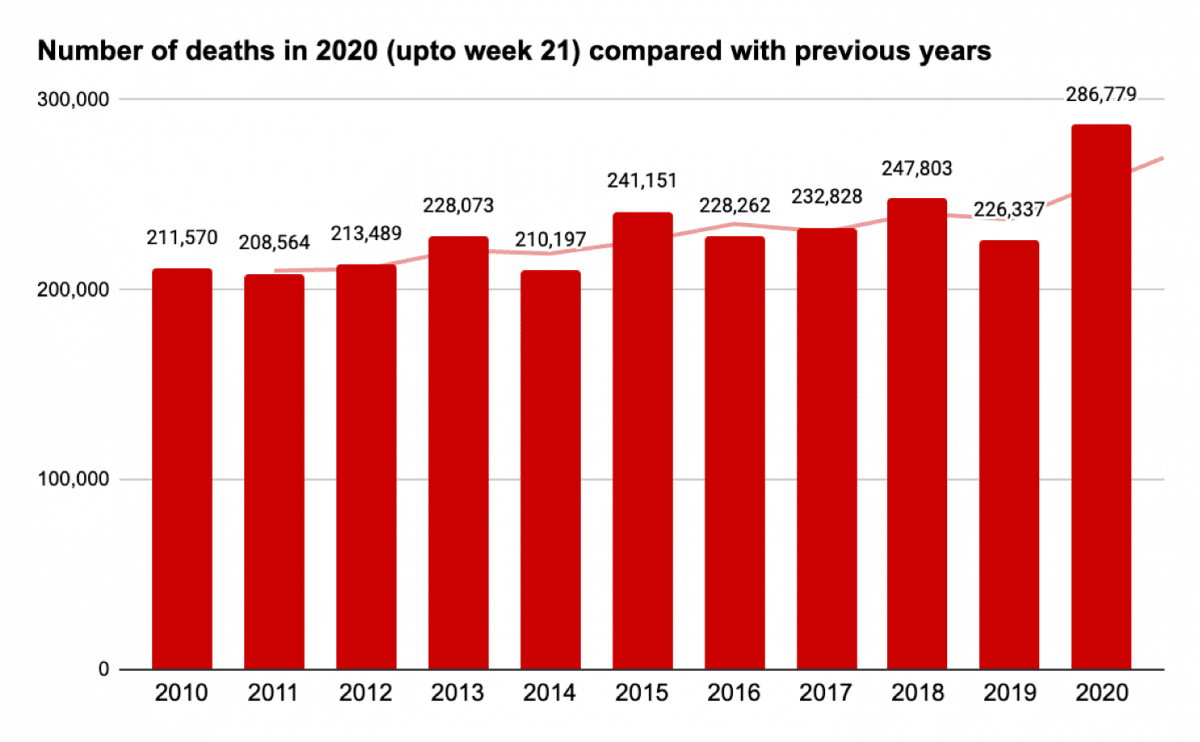
Estimating excess death comparisons compared with a previous year would give a range of excess estimated between 38,976 (2018) and 78,215 (2011). The population has been increasing and ageing and there has been a trend for the absolute number of deaths to increase over time.
Modelling the trend with harmonic regression based on years 2010 – 2019 we can predict the number of expected deaths in 2020:
- The ONS 5-year average is 235,293 deaths, which gives an excess of 51,486;
- Using the harmonic regression trend* predicts 257,081 deaths in 2020 an excess of 29,698
Harmonic regression is used in phenomena which tend to exhibit periodic rhythms.
Excess by Age in 2020:
We used the harmonic regression method to predict excess deaths over different age bands. In those 44 and under we observed no excess registered deaths in 2020 up to week 21 (the 15th May). Above this age, we observed excess deaths.
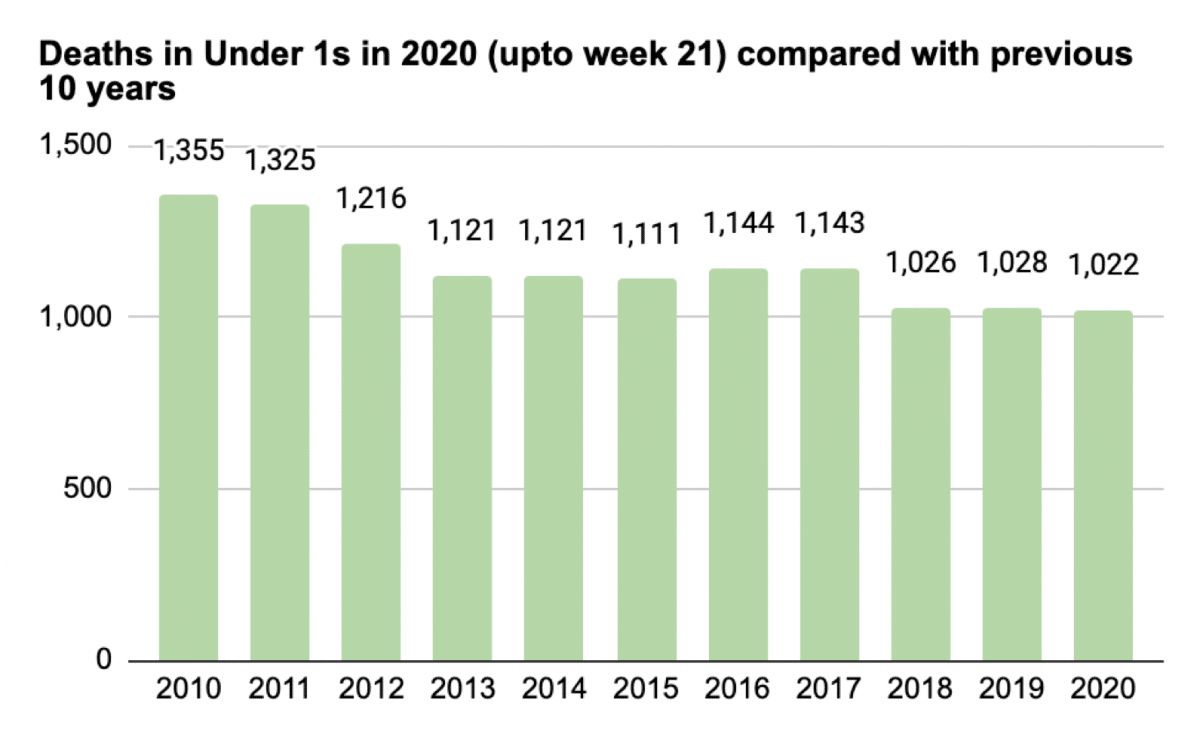
Excess death comparisons in < 1s in 2020 (No excess)
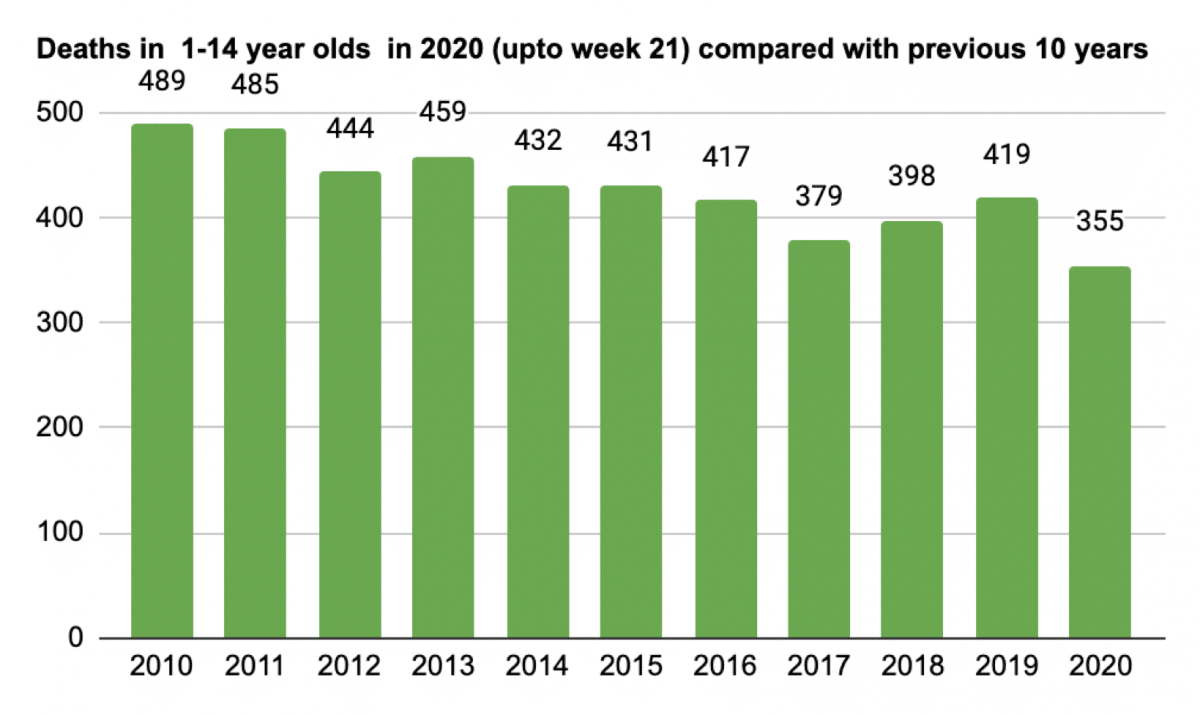
Excess death comparisons in < 1 to 14-year-olds in 2020 – No excess.
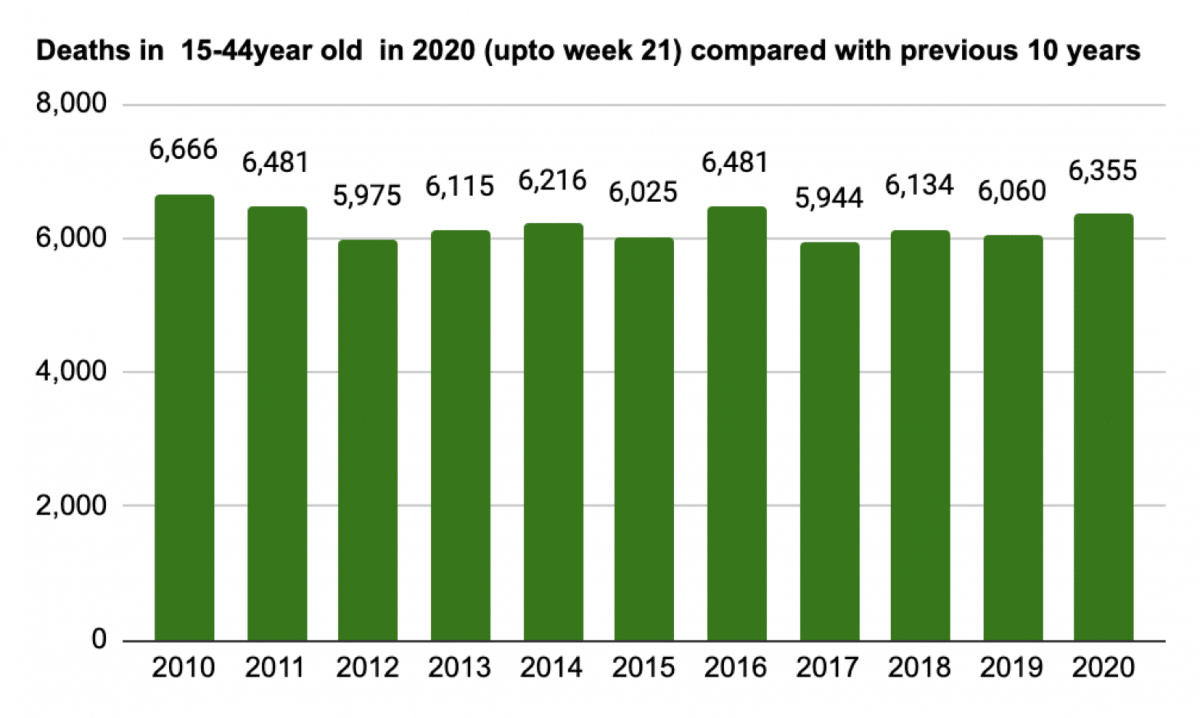
Excess death comparisons in 15 to 44 year-olds in 2020 – No excess.
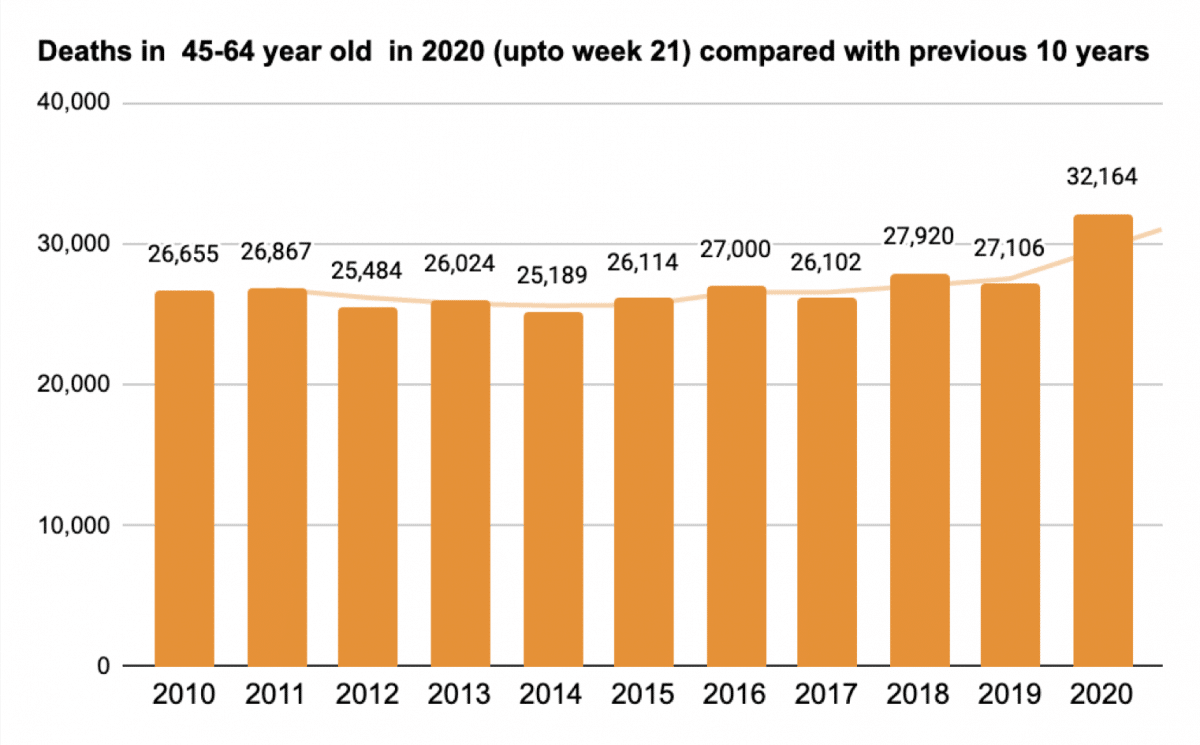
Excess death comparisons in <45 to 64 year-olds in 2020 – predicted deaths 27,164, which gives an excess of 5,000.
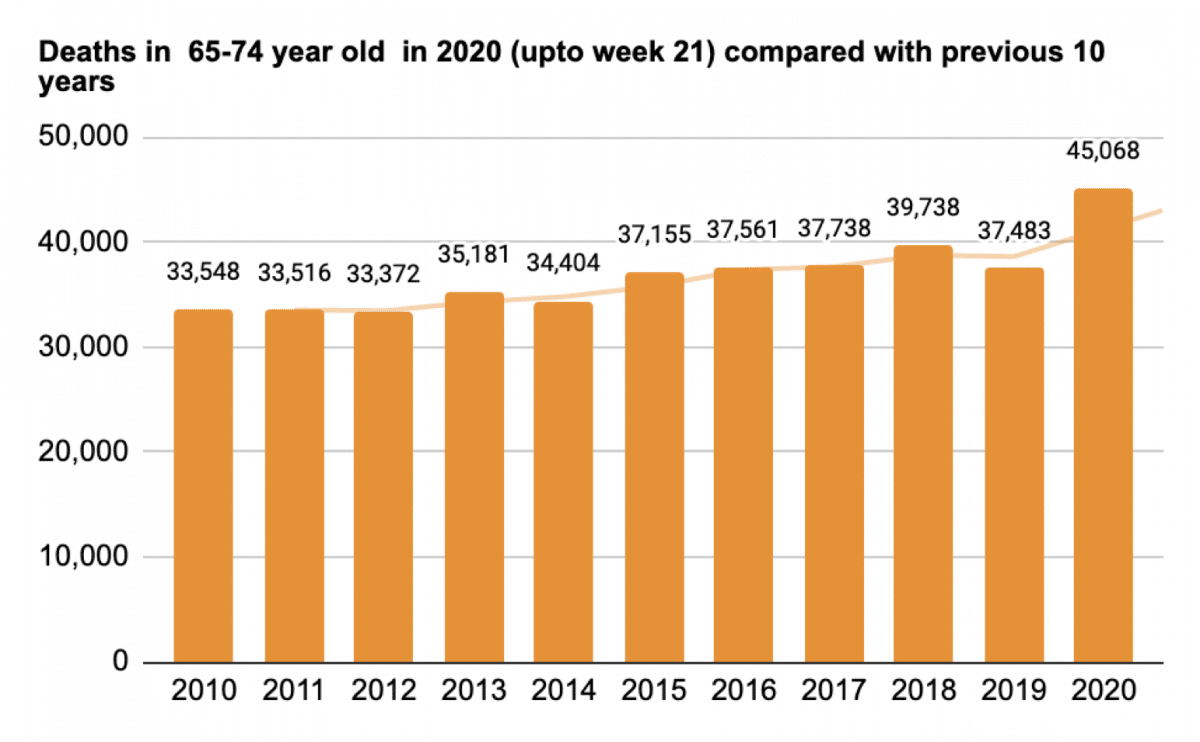
Excess death comparisons in 65-74 year-old’s in 2020 – predicted deaths 40,777, which gives an excess of 4,291 deaths.
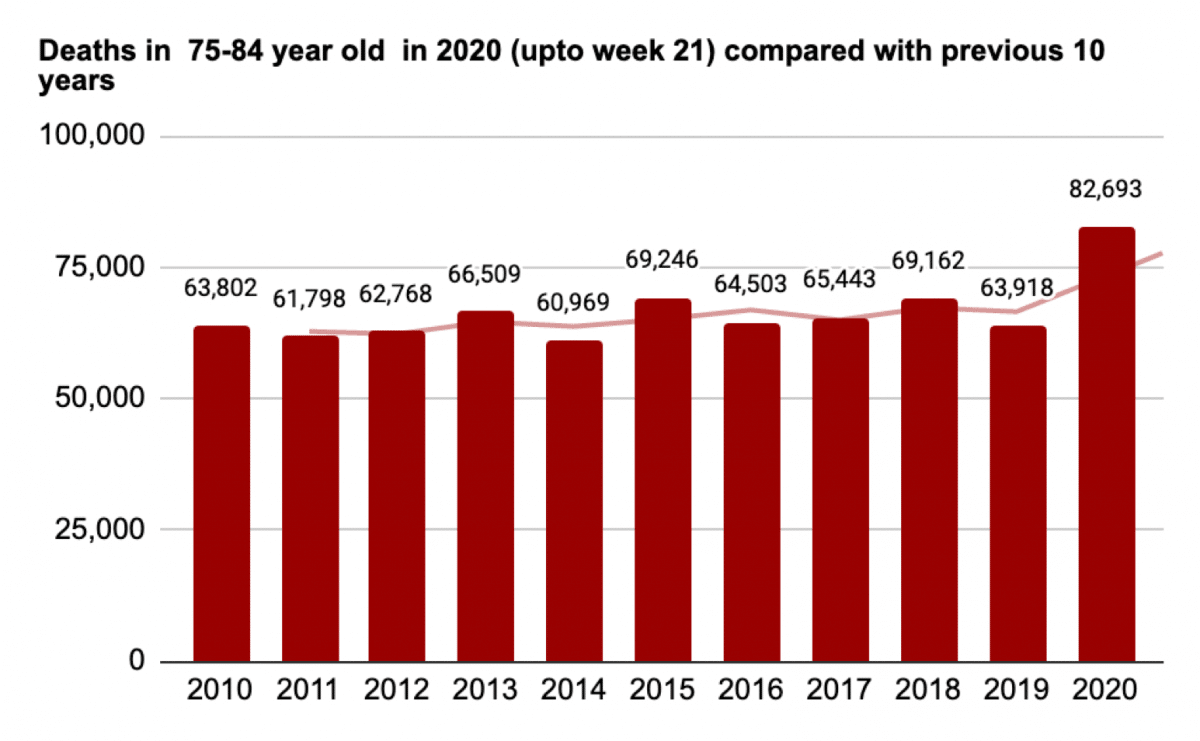
Excess death comparisons in 75 to 84 year-old’s in 2020: predicted deaths 71,146, which gives an excess of 11,547 deaths.
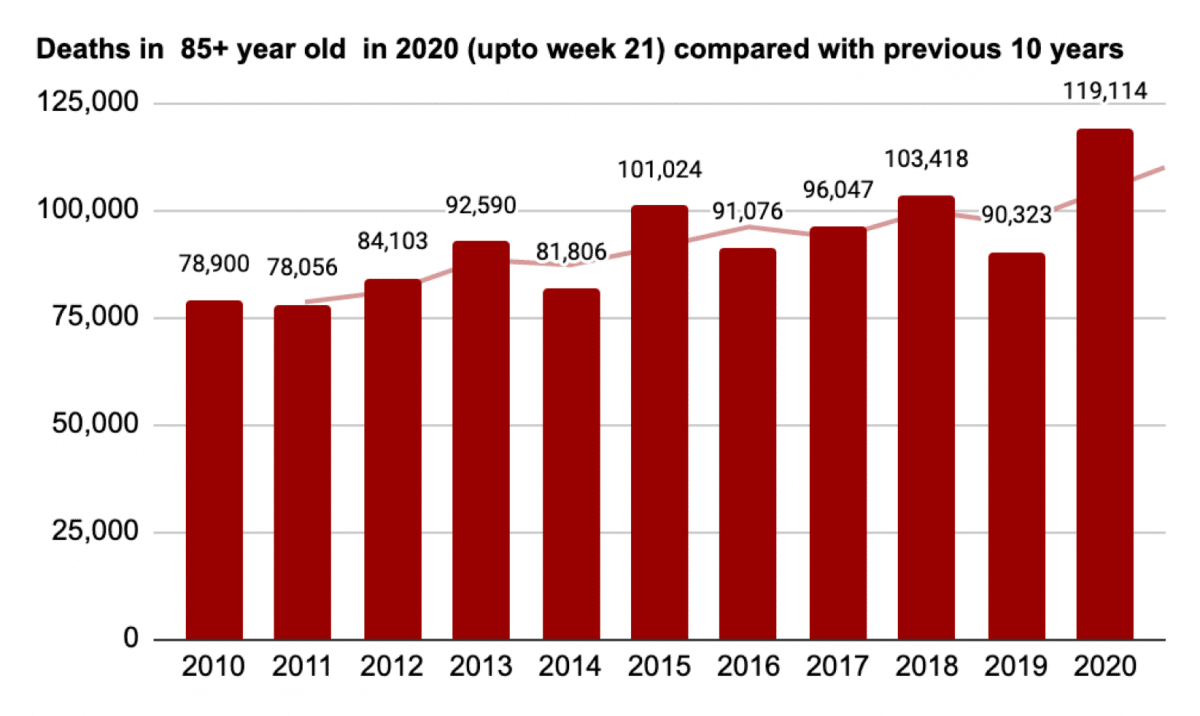
Excess death comparisons in 85+ year old’s in 2020 – predicted deaths of 110,789, which gives an excess of 8,325 deaths.
Disclaimer: the article has not been peer-reviewed; it should not replace individual clinical judgement, and the sources cited should be checked. The views expressed in this commentary represent the views of the authors and not necessarily those of the host institution, the NHS, the NIHR, or the Department of Health and Social Care. The views are not a substitute for professional medical advice.
AUTHORS
Jason Oke is a Senior Statistician at the Nuffield Department of Primary Care Health Sciences and Module Coordinator for Statistical Computing with R and Stata (EBHC Med Stats), and Introduction to Statistics for Health Care Research (EBHC), as part of the Evidence-Based Health Care Programme.
Carl Heneghan is Professor of Evidence-Based Medicine, Director of the Centre for Evidence-Based Medicine and Director of Studies for the Evidence-Based Health Care Programme. (Full bio and disclosure statement here)