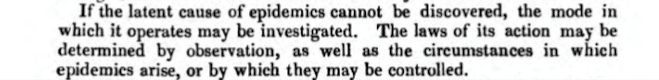
COVID-19: William Farr’s way out of the Pandemic
April 11, 2020
Carl Heneghan, Tom Jefferson
The death rate is a fact; anything beyond this is an inference.
William Farr (1807 – 1883)
Readers will be well aware of our tendency to look back in time to help us look forward to what next. Understanding William Farr’s contribution to outbreaks is crucial to understanding our way out of this pandemic.
William Farr, a UK epidemiologist and early statistician. Farr recognised the importance of analysing death statistics and attributing causation. These vital statistics set out how to analyse mortality and epidemics.
in a letter to the Registrar General, In 1840, Farr set out his theories on the smallpox outbreak. His observations set out our current thinking on the epidemiology of infections.
Farr showed that epidemics rise and fall in roughly a bell-shaped curve (a normal distribution) shape.
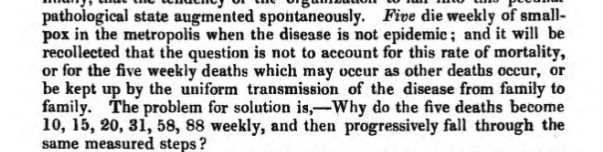
Farr shows us that once peak infection has been reached then it will roughly follow the same symmetrical pattern on the downward slope. However, under testing and variations in testing regimes means we have no way of knowing when the peak of infections occurred.
In this situation, we should use the data on deaths to predict the peak. There is a predicted time lag from infection to COVID deaths of approximately 21 to 28 days.
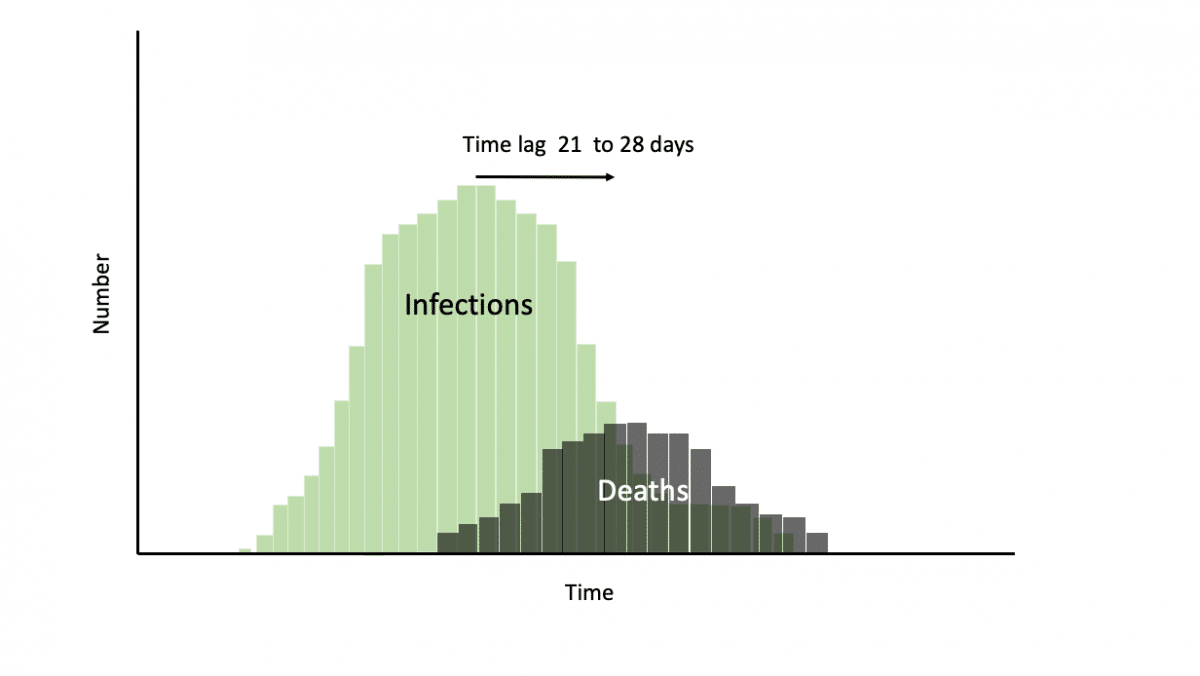 Once peak deaths have been reached we should be working on the assumption that the infection has already started falling in the same progressive steps. Using deaths as the proxy for falling infections facilitates the planning of the next steps for reopening those societies that are in lockdown.
Farr also explained the problem with density in preserving health and life.
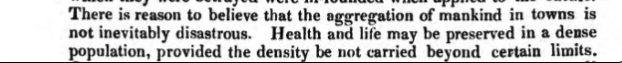
In situations of high-density the course of infection may be prolonged; mortality may be extended in confined populations (e..g, in nursing homes and hospitals) particularly if distancing cannot occur and if stringent measures to prevent onward infection are not instituted. In the previous SARs outbreak, a lack of isolation facilities allowed infection of patients admitted to the same wards for other reasons: many admissions – as is the case now – did not have typical signs of SARS, which led to worsening of infection control.
In the second phase of the 2002-3 outbreak in Toronto transmission occurred mainly within health care settings. Hospital workers were placed under a 10-day work quarantine, avoided public places, close contact with friends and family, and wore a mask whenever public contact was unavoidable to prevent transmission.
Farr, also illustrated that those who are the most ‘mortal die out’, and in a pandemic are those in most need of shielding.
In the midst of a pandemic, it is easy to forget Farr’s Law, and think the number infected will just keep rising, it will not. Just as quick as measures were introduced to prevent the spread of infection we need to recognise the point at which to open up society and also the special measures due to ‘density’ that require special considerations.
But most of all we must remember the message Farr left us: what goes up must come down.
Covid 19 – a postscript to our use of historical material
Many of our readers may think that some of the historical figures and fathers of our disciplines we cite in our blogs are all-seeing and all-knowing forebearers.
This is a blasphemous proposition and not our view at all. Sometimes, even giants like William Farr, got it badly wrong.
Farr was anticontagionist, one of those Victorian era scientists who thought that miasmata produced by sewage, rubbish and dirt were the cause of communicable disease. Perhaps one of the most iconic images of this theory is Farr’s pyramid representing the cases of cholera by London suburb by the height of habitation. (Farr W. Cholera in England,-1844-49).
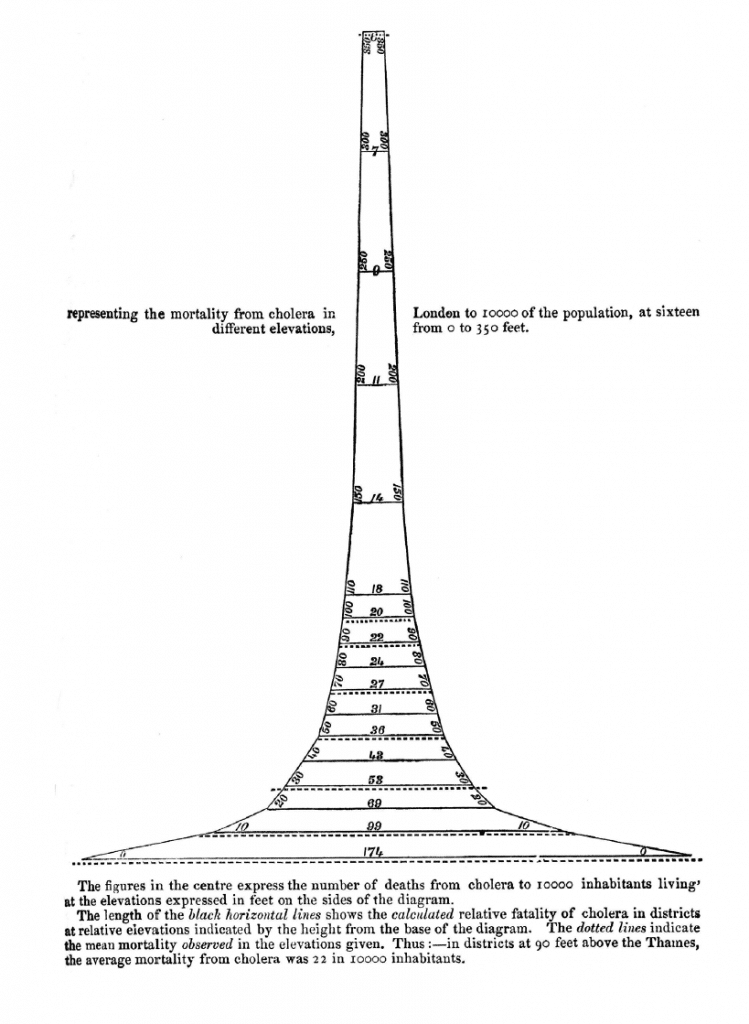
The pyramid shows the incidence of deaths from cholera in London in relation to the height of their dwelling. The higher they lived, the fewer deaths.
The inference is that good air (buonaria) protected or did not cause cholera, which bad air (malaria, near the Thames) did.
This was the wrong inference because the confounder was the purity of the water which made it less likely to get cholera and was different in quality in the higher, richer, suburbs of London.
So Farr got it wrong in this case, but the consequences of his wrong inference were positive, as they contributed to the sanitation movement which eventually got streets cleaned and built sewers well away from water mains.
The message is simple: always think of an alternative explanation for your observations.
 Tom Jefferson is an Epidemiologist.
Disclosure statement is here

Carl Heneghan is Professor of Evidence-Based Medicine, Director of the Centre for Evidence-Based Medicine and Director of Studies for the Evidence-Based Health Care Programme. (Full bio and disclosure statement here)