England and Wales mortality during the COVID-19 outbreak – Update 21st April
March 16, 2020

Nick DeVito, Carl Heneghan, Jason Oke
Updated 21st April
Lay Summary by Mandy Payne, Health Watch
In an outbreak, understanding the impact on overall rates of death can provide vital information about the effect in the population at large.
Essential Questions:
- Are the number of deaths rising?
- How do they compare with previous years?
- And in this current outbreak, are the respiratory deaths on the rise?
We are tracking the ONS data on deaths, which update on the 20th April 2020.
Update April 21st: today’s data release refers to the week ending the 10th April (week 14)
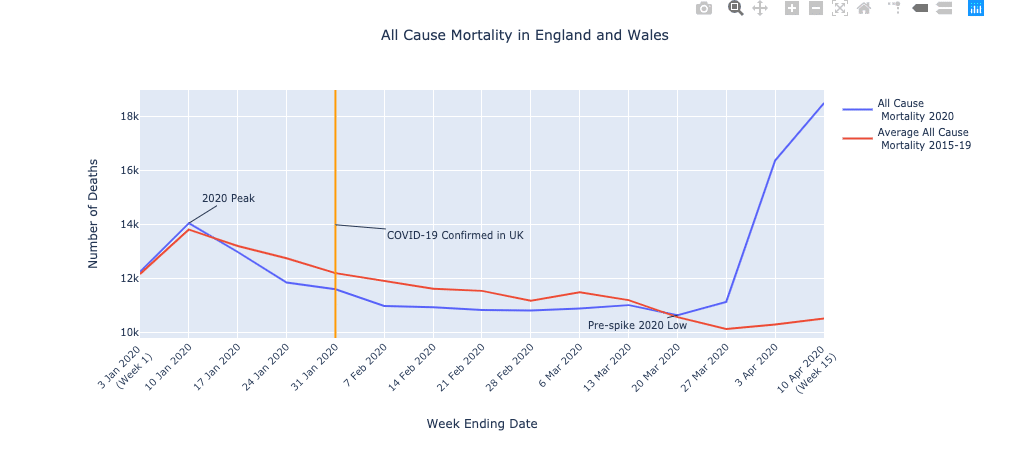
- Total deaths all ages in week fifteen, 18,516.
- Week 15 deaths are increased by approximately 75% more than expected at this time of year, RR 1.75 (95% CI 1.71 to 1.80; p<0.0001) compared with the average of the 5 previous years (10,520 deaths occurred in week 14 over the last 5 yrs).
- Respiratory deaths 1,810 in week 15: a decrease of 298 (14%) compared with the previous week.
- 6,213 deaths in week 13 had COVID-19 mentioned on the death certificate.
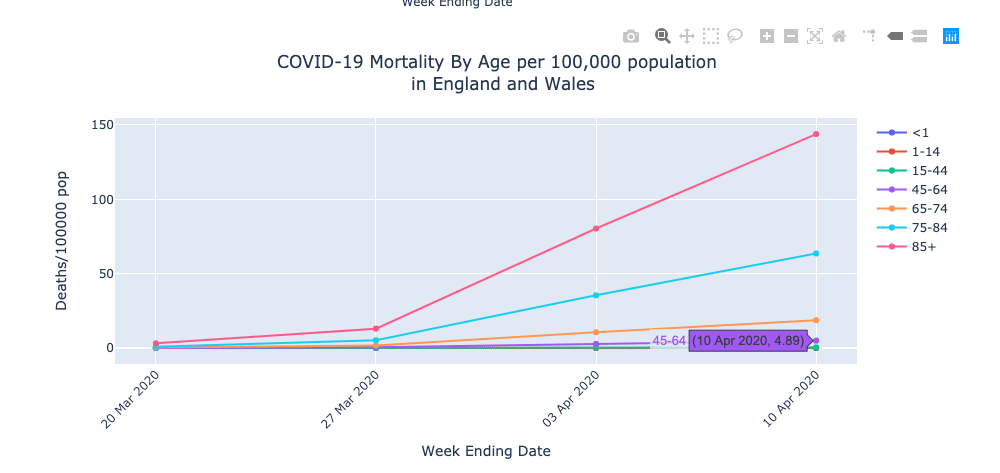
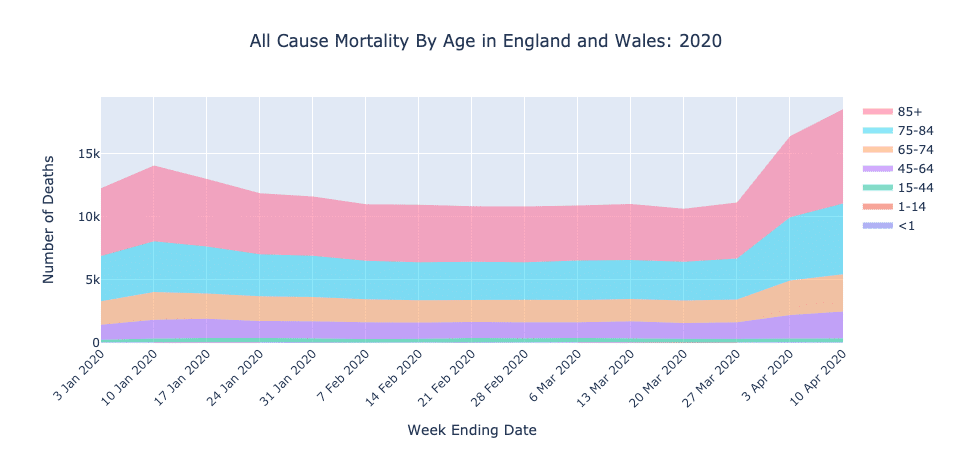
- 70% of all the deaths occurred in over 75-year-olds (13,075 of 18,615)
- In the previous peak of deaths in week 2 (10th Jan) 14,058 deaths occurred with 2,477 respiratory deaths.
interactive graphs available here

Week 2:
- Deaths in England and Wales peaked in week 2 at 14,058.
- Deaths due to all respiratory diseases hit a peak of 2,477
Week 8:
- Deaths due to all respiratory diseases down by more than a third (36%) since the peak to 1581.
Week 9:
- All deaths down by 24% since the peak to 10,816.
Week 10:
- Deaths from weeks 3 to 10 have been an average of 3% less than in the previous five years, this difference on. the previous 5 years reduced to 2% in week 10.
Week 12:
See BMJ article: Carl Heneghan: Assessing mortality during the covid-19 outbreak Posted March 11, 2020
- Deaths continue to drop to 10,645.
- There is no detectable difference with the average of the previous 5 years (10,645 vs. 10,573, RR 1.0068 (95% CI< 0.098 to 1.03, p =0.62).
Week 13:
- Total deaths all ages in week thirteen, 11,141 (an increase on week 12 by 4.7%).
- Week 13 deaths are increased by approximately 10% compared with the average of the 5 previous years (10,130 deaths occurred in week 13 over the last 5 yrs).
Week 14:
today’s data release refers to the week ending the 3rd April (week 14)
- Total deaths all ages in week fourteen, 16,387 (an increase on week 13 by 47%).
- Week 14 deaths are increased by approximately 59% compared with the average of the 5 previous years (10,305 deaths occurred in week 14 over the last 5 yrs).
- Respiratory deaths 2,106 for week 14, an increase of 572 (27%) on the previous week.
- 3,475 deaths in week 13 had COVID-19 mentioned on the death certificate.
- Deaths in over 85s, 6,428; up by 45% on last weeks 4,444 deaths in this age group (Rate 80.3 deaths per 10,000 population.
- 70% of the deaths occurred in over 75-year-olds (11,433 of 16387)
- In the previous peak of deaths in week 2 (10th Jan) 14,058 deaths occurred with 2,477 respiratory deaths.
Disclaimer: the article has not been peer-reviewed; it should not replace individual clinical judgement and the sources cited should be checked. The views expressed in this commentary represent the views of the authors and not necessarily those of the host institution, the NHS, the NIHR, or the Department of Health and Social Care. The views are not a substitute for professional medical advice.