Exponential growth: what it is, why it matters, and how to spot it
September 23, 2020
This article is for readers who are increasingly familiar with the term “exponential growth”, for example from news coverage of the covid-19 pandemic, and would like a non-mathematical explanation
It has been commented that “exponential” growth is often taken to be a synonym for “fast” growth. Something is “fast” if it has a high speed. We will see in this article that exponential growth doesn’t have a speed: it is the way the speed keeps changing that is important.
Part one: Two ways to understand exponential growth
Here’s how I learnt exponential growth in maths class: when the speed of growth is proportional to the size of the population, that’s exponential growth. A textbook example is to imagine a small population of red kites living in a large, food-rich, predator-free countryside. If there are 20 red kites in the breeding population, they will have twice as many chicks as if there are 10 red kites in the breeding population. The rate of growth is proportional to the current number of red kites.
Notice that there is not a single speed of growth. We can’t say that the increase is 10 red kites per year, or 20 red kites per year, or any fixed number of red kites per year. Whatever the increase is this year, next year there will be more red kites – and the increase will be greater than this year.
Here’s another way to understand exponential growth, equally correct. When there’s a fixed doubling time, we have exponential growth. Suppose (for the sake of argument) each year a typical pair of red kites have two young who successfully reach breeding age. Then the population next year (in our hypothetical, infinitely resourced and hazard-free environment for red kites) will be twice as big as the population next year. The population the year after will be twice as big again, and so on. The doubling time is one year.
Of course, you’ve noticed that we’re glossing over some inconvenient details, such as mortality, that will dent the growth of the numbers of red kites. In the real world, exponential growth can’t carry on indefinitely. Nevertheless, it is often a good match for things that happen in the real world. A founding principle of medical statistics is that “all models are wrong, but some models are useful” (attributed to GEP Box).
By ‘model’ we mean a mathematical model, and by a mathematical model we mean the idea that a mathematical formulation can match something that happens in the real world. We will see that this can, and did, apply to epidemics such as the covid-19 pandemic.
The Table shows the number of confirmed covid-19 cases in the UK in 2020 before the run up to the “lockdown” on 23rd March (source: https://coronavirus.data.gov.uk/cases , accessed 2020-09-21). (At this time, there was no community testing: this is the number of hospitalised confirmed cases of covid-19.) We notice immediately that there is not a fixed rate of growth: it’s not 10 new cases per day, or 50 cases per day, or a thousand cases per day. The number of new cases goes up with the number of existing cases. On average, it’s about 22% of the number of existing cases. That’s our first concept of exponential growth.
Our second way of understanding exponential growth is to think of doubling times. From that 22%, I calculate a doubling time of 2.7 days, so I’ve highlighted in bold, every third day in the table. Decide for yourself: is the number of cases roughly doubling between each highlighted row? The “exponential growth” way of looking at this data is not exactly right, but in my view it’s not far wrong.
As we have written previously, the date column can’t be taken too literally: this is the date of reporting, but not the date a case happened.
Table 1. Reported cases of covid-19 in the UK in the month before lockdown measures were announced.
| Date |
Cases to date |
New cases reported |
Cumulative cases |
| 23/02/2020 |
10 |
1 |
11 |
| 24/02/2020 |
11 |
2 |
13 |
| 25/02/2020 |
13 |
5 |
18 |
| 26/02/2020 |
18 |
4 |
22 |
| 27/02/2020 |
22 |
8 |
30 |
| 28/02/2020 |
30 |
12 |
42 |
| 29/02/2020 |
42 |
5 |
47 |
| 01/03/2020 |
47 |
22 |
69 |
| 02/03/2020 |
69 |
40 |
109 |
| 03/03/2020 |
109 |
55 |
164 |
| 04/03/2020 |
164 |
56 |
220 |
| 05/03/2020 |
220 |
51 |
271 |
| 06/03/2020 |
271 |
81 |
352 |
| 07/03/2020 |
352 |
60 |
412 |
| 08/03/2020 |
412 |
57 |
469 |
| 09/03/2020 |
469 |
148 |
617 |
| 10/03/2020 |
617 |
259 |
876 |
| 11/03/2020 |
876 |
406 |
1282 |
| 12/03/2020 |
1282 |
484 |
1766 |
| 13/03/2020 |
1766 |
478 |
2244 |
| 14/03/2020 |
2244 |
361 |
2605 |
| 15/03/2020 |
2605 |
442 |
3047 |
| 16/03/2020 |
3047 |
610 |
3657 |
| 17/03/2020 |
3657 |
770 |
4427 |
| 18/03/2020 |
4427 |
999 |
5426 |
| 19/03/2020 |
5426 |
1053 |
6479 |
| 20/03/2020 |
6479 |
1259 |
7738 |
| 21/03/2020 |
7738 |
1196 |
8934 |
| 22/03/2020 |
8934 |
1378 |
10312 |
| 23/03/2020 |
10312 |
2335 |
12647 |
Part two: how to recognise exponential growth
A simple way to look out for exponential growth is to try to spot a doubling time. A concerned newspaper reader in the Spring of 2020 might notice the apparent doubling between the 23rd and 26th of February, for example, and then keep watching the news to see if cases continue to double approximately every three days.
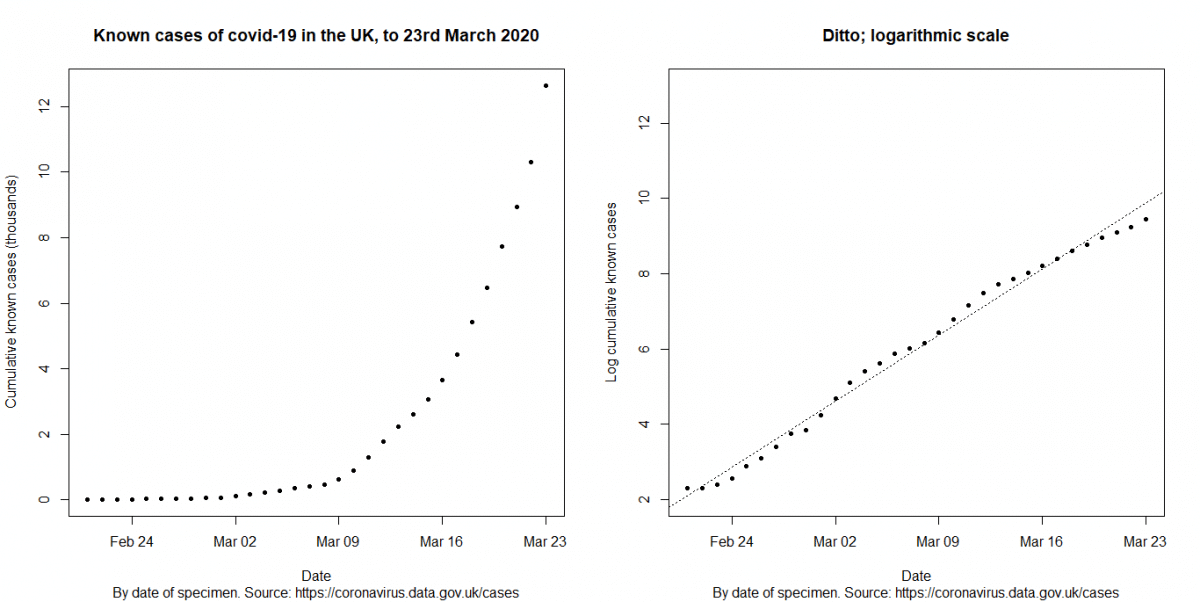
For the mathematically minded, the correct way is to plot a graph of the logarithm of the total – the number of red kites in Oxfordshire, or, the cumulative number of covid cases in the UK – against time. Logarithms are the inverse of the exponential function: if we have exponential growth, then a graph of the log total against time will follow an approximately straight line.
The Figure shows the same data as the table. The cumulative number of cases is curved (left hand plot), but its logarithm follows a straight line. (We can use the fitted line to estimate the doubling time: the slope of the fitted line is 0.251 log cases per day, and log(2)/0.251 = 2.76 days, similar to the 3 days we estimated by looking at the table.)
Part three: why exponential growth matters
Exponential growth matters because it is easy to underestimate. In the legend of the wheat and the chess board, a petitioner asks a king for a grain of wheat on the first square of a chess board; two grains of wheat on the second square; and so on, doubling the amount of wheat on each square until all 64 squares are full. The king accepts what he takes to be a modest request, only to discover that he has promised to deliver more wheat than the whole world can produce.
Look at the data in Table 1 for the last few days of February. If you were a UK politician reviewing the data at the end of February, you would see a rate of growth of tens of cases per day. How long might you think it would take before the disease overwhelms the National Health Service? For an organisation with over 100,000 hospital beds (source: The King’s Fund), there might seem to be plenty of time – months? years? – before this condition demands even a tenth of capacity.
But not if we realise this is exponential growth. Doubling every 3 days would take us from about 50 cases, to 100, to 200, to 400, to 800, to 1,600, to 3,200, to 6,400 to 12,800 by the 24th of March. As you can see in the Table, the doubling rate was slightly faster, and the UK reached over 12,000 hospitalised cases by 23rd March. (At that rate, four more doublings would have been more covid admissions than total beds in NHS hospitals: of course that isn’t what happened – the UK took action, the growth of the disease was halted.)
This is why exponential growth, when it happens, must be recognised and mustn’t be mistaken for merely “fast”. In the early days – the top rows of the Table – the growth isn’t fast, in fact; just scores of new cases per day, in a country of millions. Exponential growth will become fast, even if it’s slow now.
In real life problems, exponential growth has an upper limit. Our hypothetical red kites will breed, but they will also age and die, and the hypothetical large, bountiful place in which they live will look less large, and less bountiful, as the red kite population grows. In the case of disease, when the cases become a sizeable fraction of the total population, so that the susceptible population is significantly smaller, growth will be slower than exponential (for more detail, see this video lecture by Dr Robin Thompson).
Authors
Richard Stevens is an Associate Professor in Medical Statistics at the Nuffield Department of Primary Care Health Sciences and Course Director of the MSc in Evidence Based Health Care (Medical Statistics).
Rafael Perera is Professor in Medical Statistics at the Nuffield Department of Primary Care Health Sciences.
Carl Heneghan is Professor of Evidence-Based Medicine, Director of the Centre for Evidence-Based Medicine and Director of Studies for the Evidence-Based Health Care Programme. (Full bio and disclosure statement here)
Richard Hobbs is a GP and Nuffield Professor of Primary Care Health Sciences, Director, NIHR English School for Primary Care Research and Director, NIHR Applied Research Collaboration (NIHR ARC) Oxford
Jason Oke is a Senior Statistician at the Nuffield Department of Primary Care Health Sciences and Module Coordinator for Statistical Computing with R and Stata (EBHC Med Stats), and Introduction to Statistics for Health Care Research (EBHC), as part of the Evidence-Based Health Care Programme.
Disclaimer: the article has not been peer-reviewed; it should not replace individual clinical judgement, and the sources cited should be checked. The views expressed in this commentary represent the views of the authors and not necessarily those of the host institution, the NHS, the NIHR, or the Department of Health and Social Care. The views are not a substitute for professional medical advice.