Tracking mortality over time – Update 12th May
May 12, 2020
Jason Oke, Nick DeVito, Carl Heneghan.
We are tracking the ONS data on deaths, which updates every Tuesday.
How can we tell if COVID-19 is the principal cause of these deaths? Or if they would have occurred in the absence of COVID-19, particularly in the elderly and people with chronic health problems? (see David Spiegelhalter’s article for an explanation).
One way is to examine the death rates and determine if more people are dying than we would expect. What we want to know is whether the reported COVID deaths represent an “excess” over the norm.
The weekly number of registered deaths for all ages.
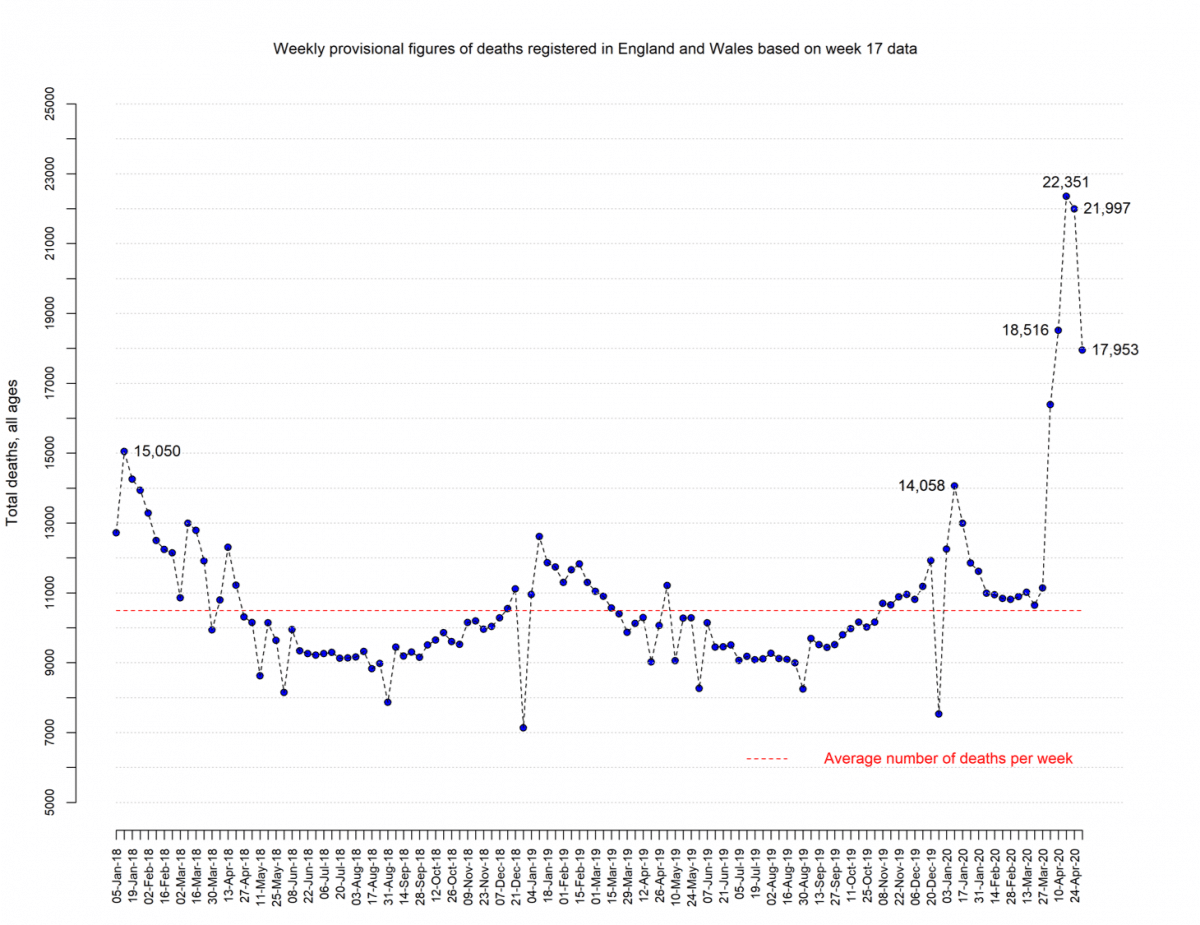
Update: today’s data release refers to the week ending the 1st May (week 18)
There were 17,953 deaths registered in week 18 in England and Wales.
This is 8,012 (81%) more than we’d expect at this time of the year (the 5 year average for this week is 9,941). Of these excess deaths, 6,035 (75%) mentioned COVID on the death certificate and 1,977 (25%) did not.
In the first 18 weeks of 2020, there were 247,261 deaths. This is 41,672 (20%) more than we’d expect (the 5-year average up to week 18 is 205,589 deaths). Of these excess deaths, 33,365 (80%) mention COVID on the certificate.
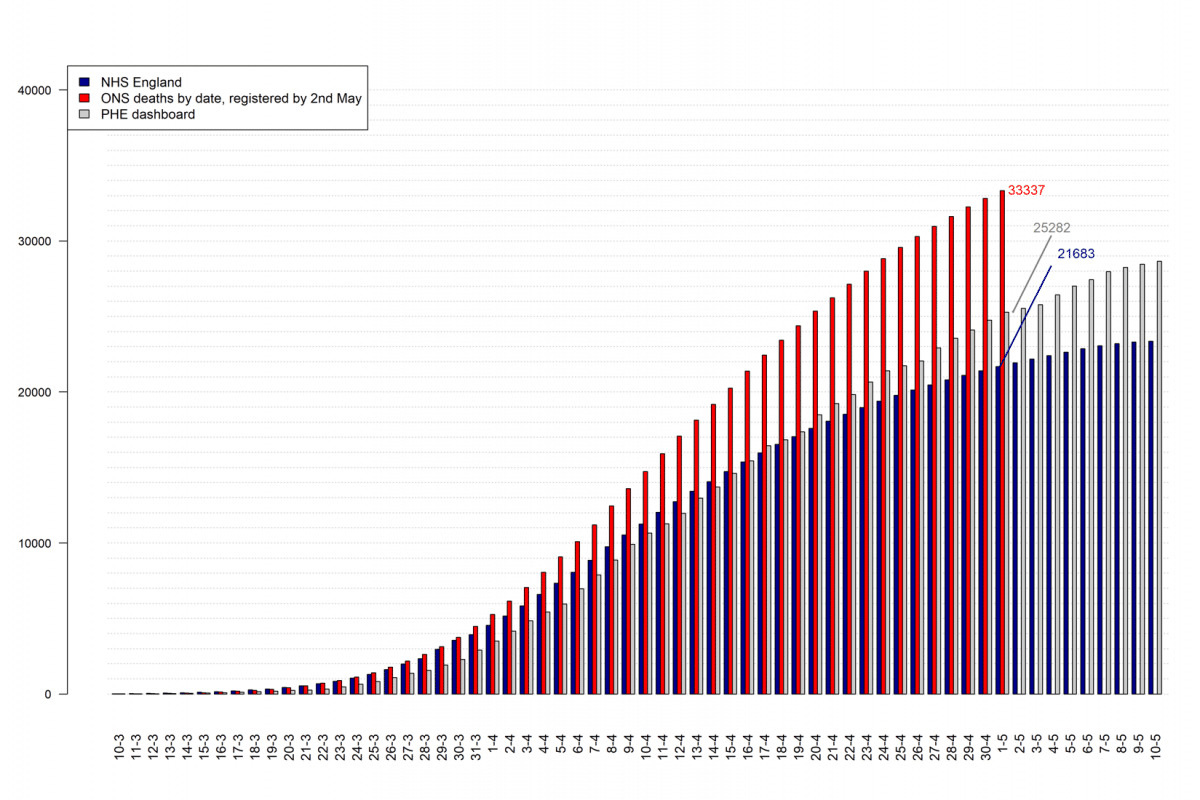
By week 18 there have been 35,044 deaths that have occurred with COVID mentioned on the certificate. This number is higher than registrations in week 18 as it includes some deaths registered in week 19 that occurred in week 18.
Since week 13 there have been an excess of 45,483 deaths observed compared to the expected for these weeks
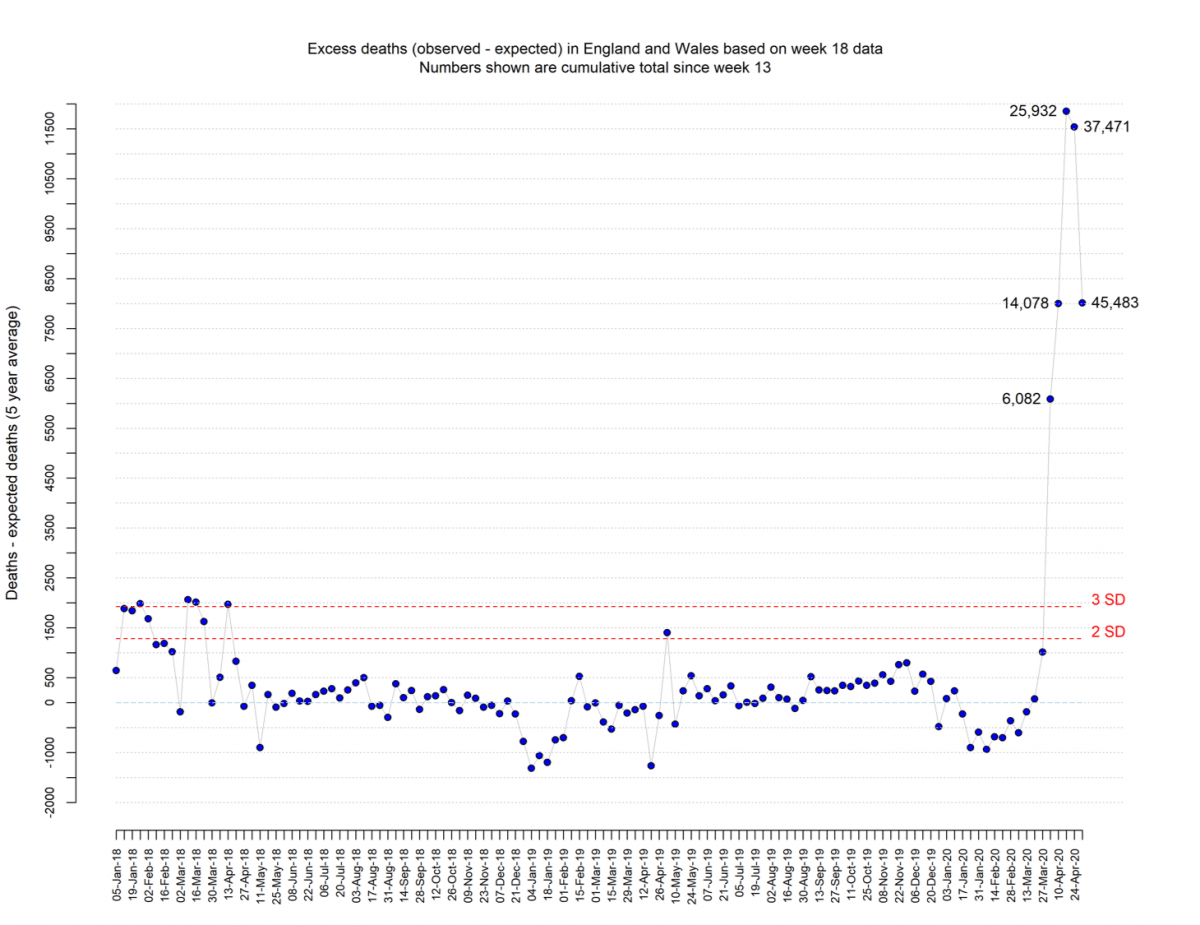
The number of deaths has exceeded 3 SDs on 5 separate occasions in the past three years. In the 2017 to 2018 winter period, there were 50,100 excess winter deaths in England and Wales. The highest previous recorded deaths (we are aware of) per week occurred in week 52 of 1999 when 18,500 deaths were registered in that week.
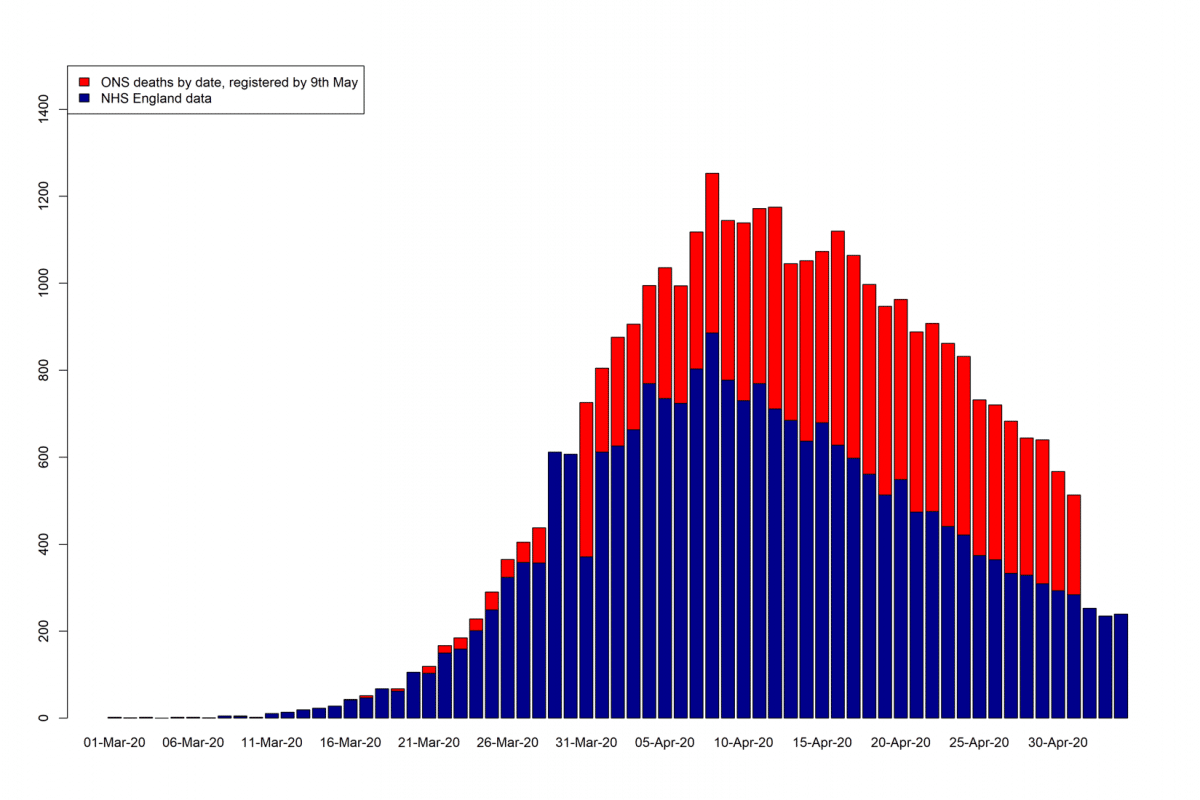
The peak of deaths is consistent with NHS England’s peak of deaths – the 8th of April.
 Cumulative numbers of deaths by different Data Source
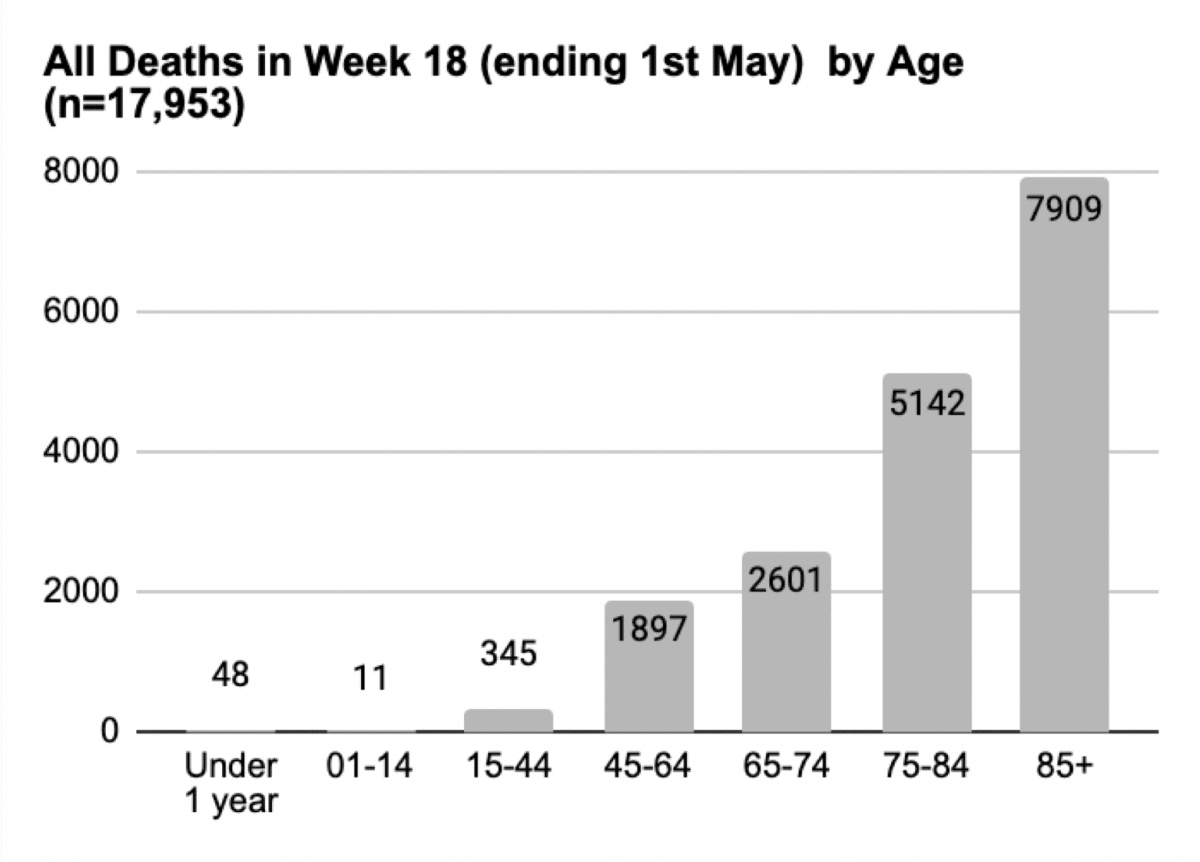
 Age of deaths
- 73% of all the deaths occurred in > 75-year olds
Interactive graphs for mortality by age per 100,000 population
Rates of death by age of the population at risk (there are fewer 85-year-olds than those in the 45 to 64 age group. What this does is show the much higher risk in the elderly compared to younger age groups
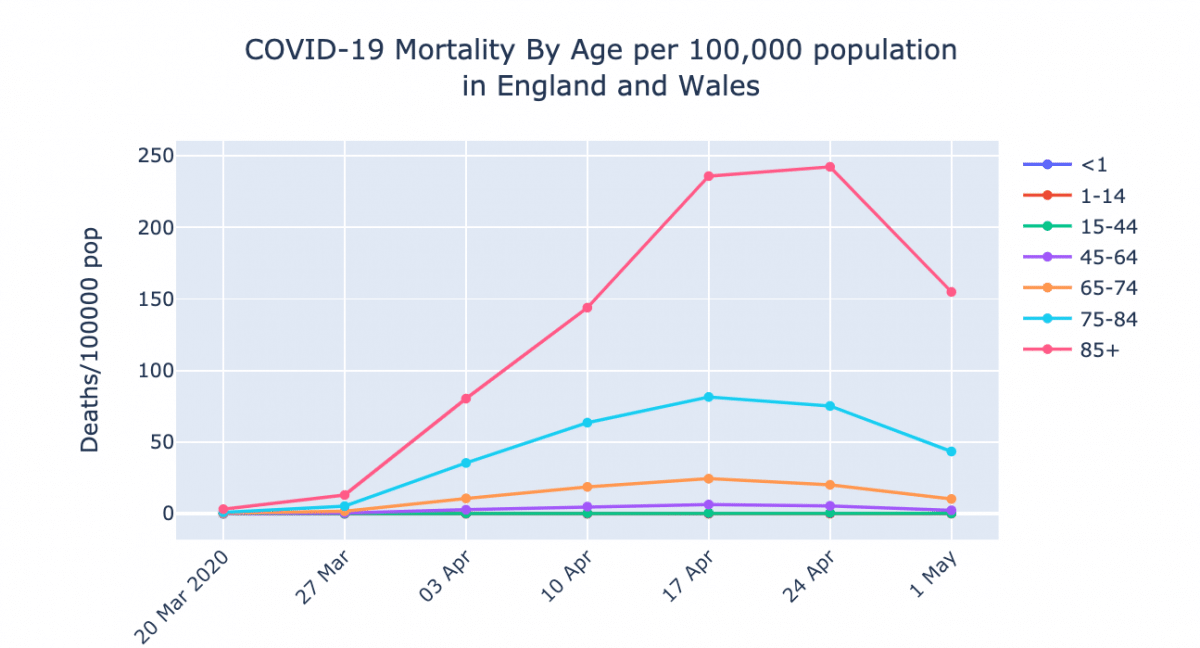
Mortality by Age per 100,000 population
- >85s: 155/100,000
- 75-84: 43 per 100,000
- 65-74: 2.3 per 100,000
- 45-64: 0.15 per 100,000
- 15-44: 0.02 per 100,000
The ONS reporting doesn’t tell us if COVID was mentioned as the disease or condition that led directly to the death.
- The immediate cause of death – (first line of the death certificate in Part I)
- The underlying causes of death – considers the chain of events leading ultimately to death (lowermost lines in Part I)
All respiratory diseases deaths (ICD-10 J00-J99)
This includes deaths from Viral pneumonia (coded as J12).
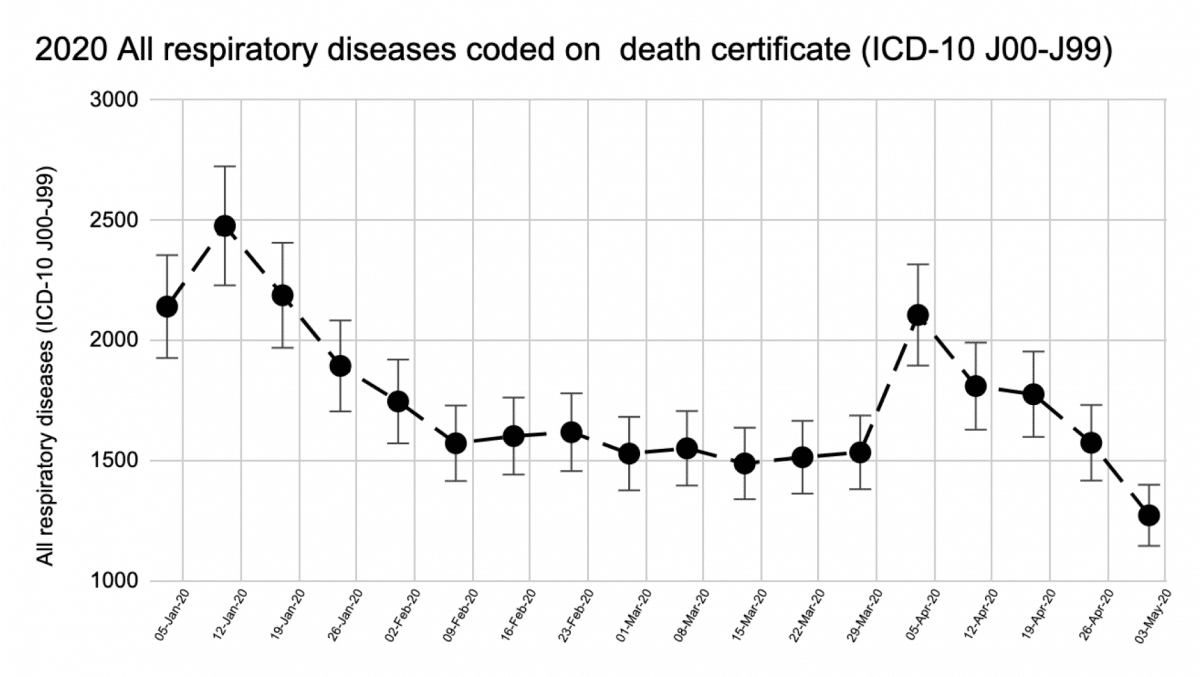
You would expect pneumonia to be on the rise if SARs-CoV-2 predominately caused viral pneumonia. A death certificate would contain both COVID and viral pneumonia if this was the case. Further in-depth analysis of ONS data is undergoing and will reveal the other causes.
Interactive graphs available here
Place of death
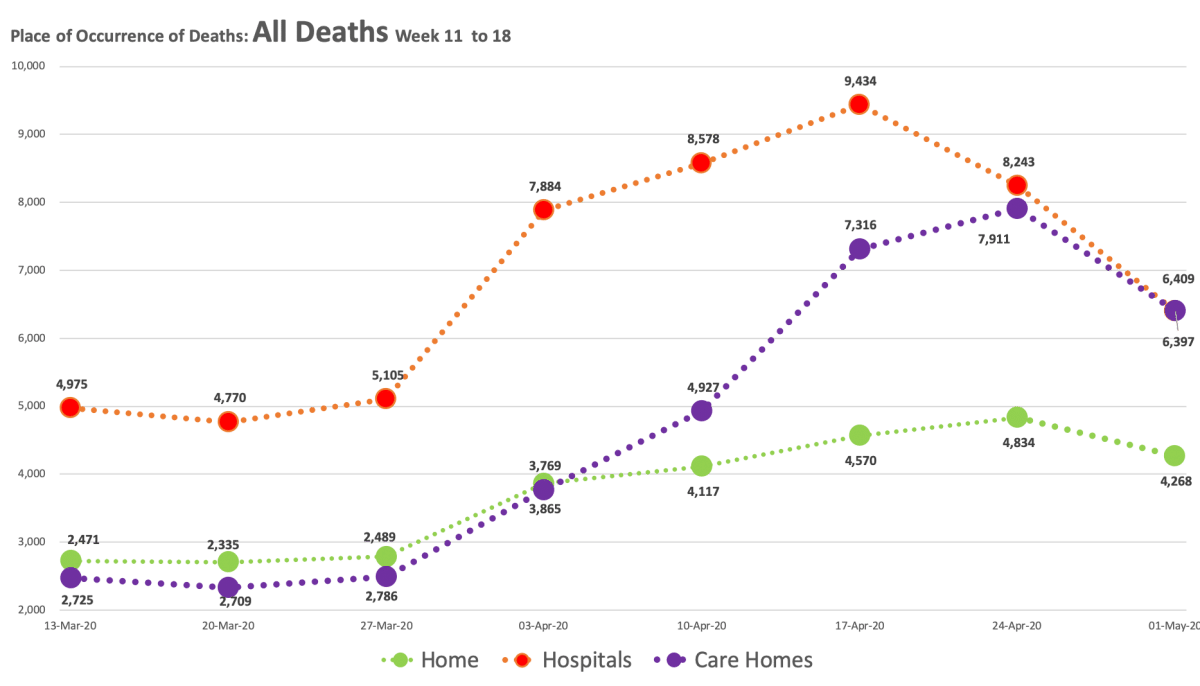
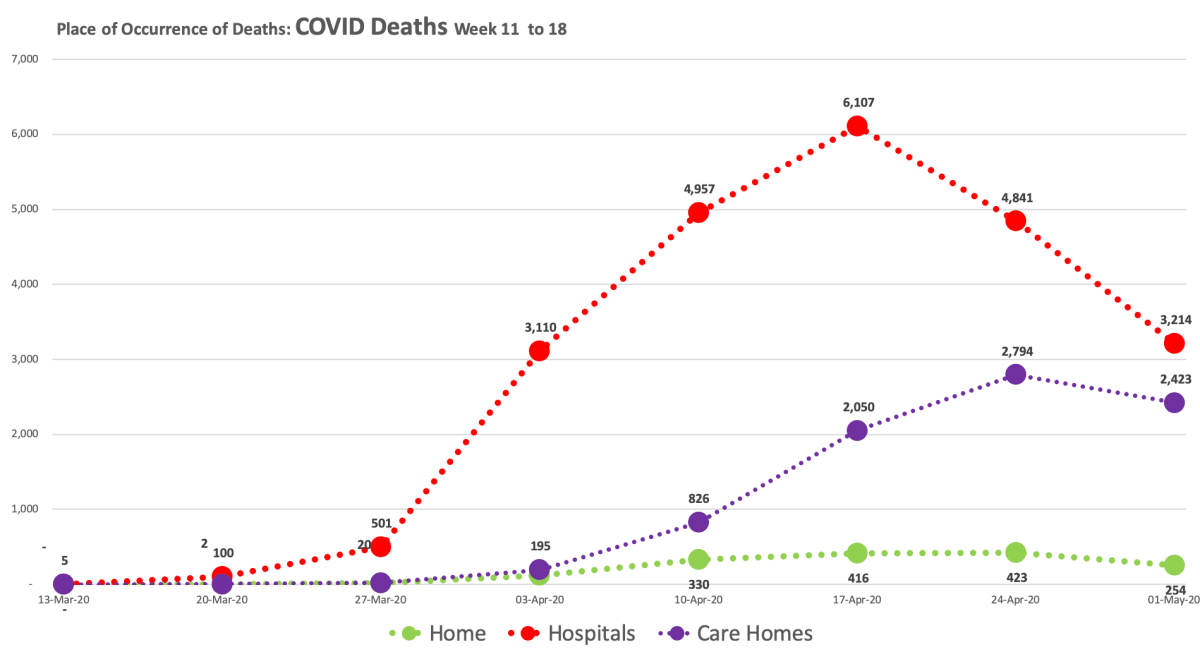
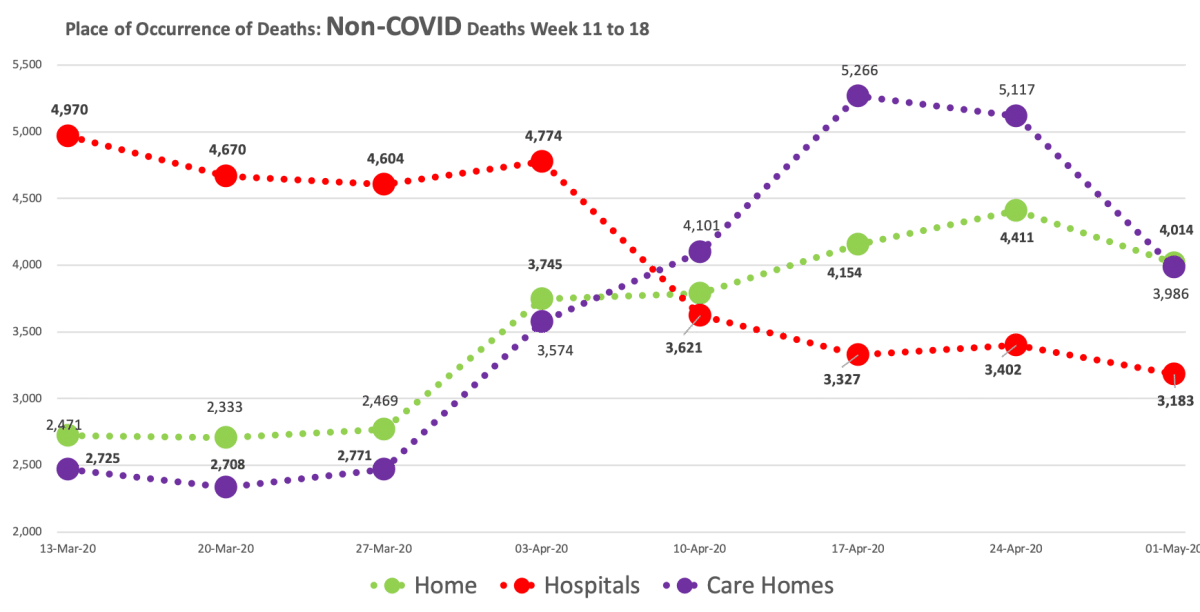
COVID deaths in the home setting remain very low while Non-COVID deaths are higher than they normally should be (compare the number on the 13th March with this week’s figure). Non-COVID Care home deaths also remain higher than they should be, while Non-COVID hospital deaths are much lower (3,183, week 11 vs. 4,970, week 18).
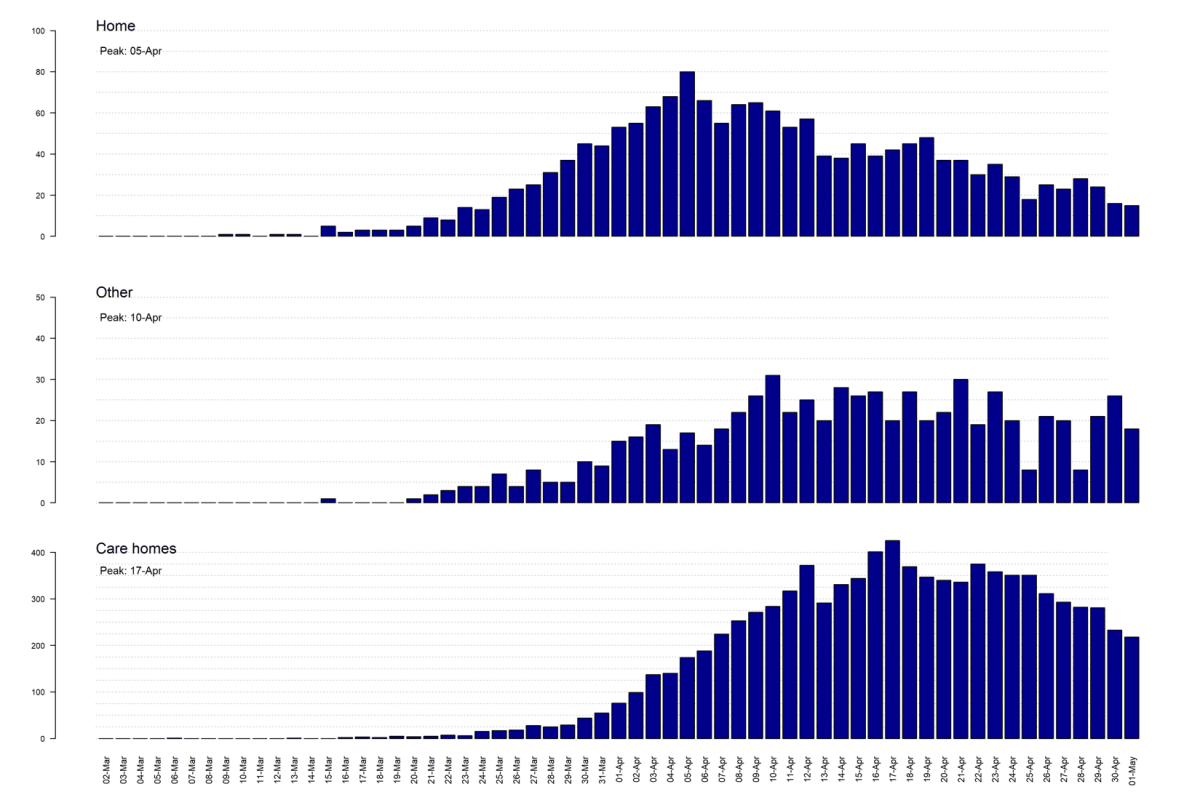
Place of occurrence by day
See also
AUTHORS
Jason Oke is a Senior Statistician at the Nuffield Department of Primary Care Health Sciences and Module Coordinator for Statistical Computing with R and Stata (EBHC Med Stats), and Introduction to Statistics for Health Care Research (EBHC), as part of the Evidence-Based Health Care Programme.
Nick DeVito is a Doctoral Researcher at the EBM DataLab.
Carl Heneghan is Professor of Evidence-Based Medicine, Director of the Centre for Evidence-Based Medicine and Director of Studies for the Evidence-Based Health Care Programme. (Full bio and disclosure statement here)
Disclaimer: the article has not been peer-reviewed; it should not replace individual clinical judgement, and the sources cited should be checked. The views expressed in this commentary represent the views of the authors and not necessarily those of the host institution, the NHS, the NIHR, or the Department of Health and Social Care. The views are not a substitute for professional medical advice.