Should COVID-19 travel quarantine policy be based on apparent new case rates?
Richard Stevens, Richard Hobbs, Rafael Perera, Jason Oke
Background
Travel restriction policy in the UK is based on rates of diagnosed covid-19, though small differences exist in interpretation between the 4 countries e.g. ‘travel corridors’, with exemptions from the 14 day quarantine on returning to the England for countries with below 20 cases per 100,000 per week.
It has been well-reported previously that apparent case rates are a function of testing rates.
Imposing quarantine restrictions on countries with apparent high case rates could create a perverse incentive for countries wishing to promote travel and tourism to test less, or to not publicly report testing rates. It may not be plausible for any responsible government to deliberately reduce testing, but government commitment to testing does vary by country for practical, financial, and political reasons. Penalising countries with high apparent rates could provide a disincentive to the roll-out of greater testing.
Alternative measures of covid-19 prevalence, less dependent on testing policy, include mortality and hospitalisations. Mortality is estimated to lag several weeks behind incidence and is therefore a particularly unreactive tool to drive policy. Hospitalisation happens much earlier in the cause of disease. Hospitalisation with covid-19 is a measure less dependent on testing policy than total diagnoses.

Methods
For countries in Europe we were able to obtain from the European Centre for Disease Control (1) 7-day covid-19 case rate[1] (2) 7-day covid-19 hospital admission rate[2]. We took population size from the same data source (1). We excluded countries with and territories with population below 200,000 for pragmatic reasons (e.g. apparent case rate or hospitalisation rate may be zero) and to avoid variability due to small numbers. We took the list of countries exempt from the UK ban on non-essential travel, and the list of “travel corridor” countries (those exempt from the requirement for quarantine on return to the UK), from the UK Foreign Office website[3].
Results
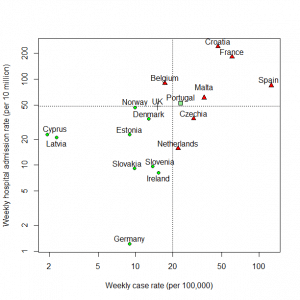
Figure 1 shows countries by reported weekly incidence rate per 100,000, with a dotted line at 20 per 100,000 to denote the reported threshold for travel restrictions vs. exemptions, and by weekly hospital admission rate, with a dotted line at 48 per 100,000, the reported level in the UK in the dataset at time of analysis. Green circles denote countries that are exempt from the UK-wide ban on non-essential travel and classified as a travel corridor country by England. Red circles denote countries that are subject to the UK-wide ban and not classified as a travel corridor country by England. Green square denotes one country, Portugal, which is currently exempt from the UK-wide ban but not classified as a travel corridor for England. A cross (+) denotes the United Kingdom.
Classifications do not correspond exactly to the 20 per 100,000 current threshold because policy is not changed daily for individual countries.
Discussion
Two countries currently subject to quarantine restrictions have a lower hospital admission rate than the UK: Netherlands, 15 per 10 million; Czechia, 35 per 10 million, compared to 48 per 10 million in the UK.
Portugal is the only country in this analysis that is exempt from the UK-wide ban on non-essential travel but not classified as a travel corridor for England. (Other such anomalies exist outside this European dataset.) Portugal is close to the current decision threshold on weekly case rate, and also the UK on hospitalisation rate. If Portugal succeeds in the coming weeks in reducing spread of covid-19, it could be eligible for a change of status in UK travel policy. However, if it were to achieve that success through greater testing and hence greater case detection, it could inadvertently undermine its apparent success. This emphasizes that reported weekly case rate is a problematic tool for policy.
Hospital admissions is also an imperfect surrogate for prevalence of covid-19 with which to compare countries: for example, younger populations may have lower covid hospital admission rates relative to overall covid prevalence. The covid situation in any country has many dimensions including prevalence, R rate, testing rate and strategy, age distribution and hospital occupancy.
Although no single metric is ideal for comparisons between countries, reported case rates have a particular limitation: they are a statistic strongly influenced by testing policy. Our analysis was restricted to certain European countries for practical reasons of data availability, but we are aware of cases outside Europe where governments have considered manipulating testing statistics to maintain low case rates. In Brazil, the government had to be compelled by a court order to resume publishing cumulative case results[4]. In the US, the President has publicly commented that “by doing all this testing, we make ourselves look bad”[5]. UK travel policy should seek to use statistics less directly linked to government policy.
Limitations
The Figure is restricted to countries for which we could obtain both hospital admissions rate and incidence rate from our single data source. For example, Greece, for which the UK modified travel policy during the writing of this article[6], is not shown because the hospital admissions rate is not available. This illustrates a practical difficulty of basing policy on hospital admissions and a likely necessity to use different metrics or a combination of metrics.
The analysis here makes between-country comparisons and is limited by the well-known difficulties with between-country comparisons [7]: however, these limitations of our analysis are also precisely the limitations of a quarantine policy based on apparent case rates.
We have only considered national level data. Using apparent case rates to inform local restrictions, within the UK, would also penalise local authority areas with high rates of testing. For example, in towns where a University is a major employer (author’s conflicts of interest to be noted here), a University offering staff testing could create a spurious rise in the apparent case rate.
Policy implications
- COVID-19 travel policy based on reported case rates could penalise countries that achieve success through widespread testing.
- Local policy could also be distorted by testing availability if based on reported case rates. At present fortunately there is no single metric on which local restrictions appear to be based.
Policy should not be based on a metric, case rate, which is also a function of government policy. Alternative or combined measures should be sought to avoid creating perverse incentives in policy development e.g. penalising countries with the best testing regimen.
Authors
Richard Stevens is an Associate Professor in Medical Statistics at the Nuffield Department of Primary Care Health Sciences and Course Director of the MSc in Evidence Based Health Care (Medical Statistics).
Richard Hobbs is a GP and Nuffield Professor of Primary Care Health Sciences, Director, NIHR English School for Primary Care Research and Director, NIHR Applied Research Collaboration (NIHR ARC) Oxford.
Rafael Perera is Professor in Medical Statistics at the Nuffield Department of Primary Care Health Sciences.
Jason Oke is a Senior Statistician at the Nuffield Department of Primary Care Health Sciences and Module Coordinator for Statistical Computing with R and Stata (EBHC Med Stats), and Introduction to Statistics for Health Care Research (EBHC), as part of the Evidence-Based Health Care Programme.
Disclaimer: the article has not been peer-reviewed; it should not replace individual clinical judgement, and the sources cited should be checked. The views expressed in this commentary represent the views of the authors and not necessarily those of the host institution, the NHS, the NIHR, or the Department of Health and Social Care. The views are not a substitute for professional medical advice.
References
[1] https://www.ecdc.europa.eu/en/publications-data/download-todays-data-geographic-distribution-covid-19-cases-worldwide accessed 12:09 BST 2020-09-04.
[2] https://www.ecdc.europa.eu/en/publications-data/download-data-hospital-and-icu-admission-rates-and-current-occupancy-covid-19 accessed 14:21 BST 2020-09-04.
[3] https://www.gov.uk/guidance/coronavirus-covid-19-travel-corridors accessed 13:01 BST 2020-09-04.
[4] (https://www.bbc.co.uk/news/world-latin-america-52980642, accessed 8th September 2020
[5] https://www.politifact.com/factchecks/2020/jun/24/priorities-usa-action/trump-positive-coronavirus-tests-slowdown-look-bad/, accessed 8th September 2020
[6] https://www.gov.uk/foreign-travel-advice/greece, accessed 8th September 2020.
[7] https://www.theguardian.com/commentisfree/2020/apr/30/coronavirus-deaths-how-does-britain-compare-with-other-countries