Does the resurgence of COVID-19 in Spain exhibit exponential growth?
September 18, 2020
Daniel Howdon, Carl Heneghan, Jason Oke
We examine data on deaths and cases in the recent resurgence of COVID-19 in Spain. While we are able to identify a two-week phase of sustained exponential growth in early to mid-July, the last two months have exhibited a steady fall in the rate of growth of cases. As of September 3, case numbers appear to be flat.
Several European countries have experienced an increase in rates of COVID-19 cases, hospitalisations, and deaths – in recent months. Particularly prominent has been the case in Spain.
We use Spanish data as of 17 September on PCR positive cases by date of symptomatic onset (or date of detection in the case of asymptomatic cases) from the Carlos III Health Institute, and deaths by date of death from the Spanish government to examine recent trends in the epidemic.
While issues with Spanish deaths data have been reported, El Pais report that such data can be considered accurate after a period of 15 days. Examination of previous versions of case data suggests that this data series forms a record that is near complete after a 14-day lag, as illustrated in Figure 1.
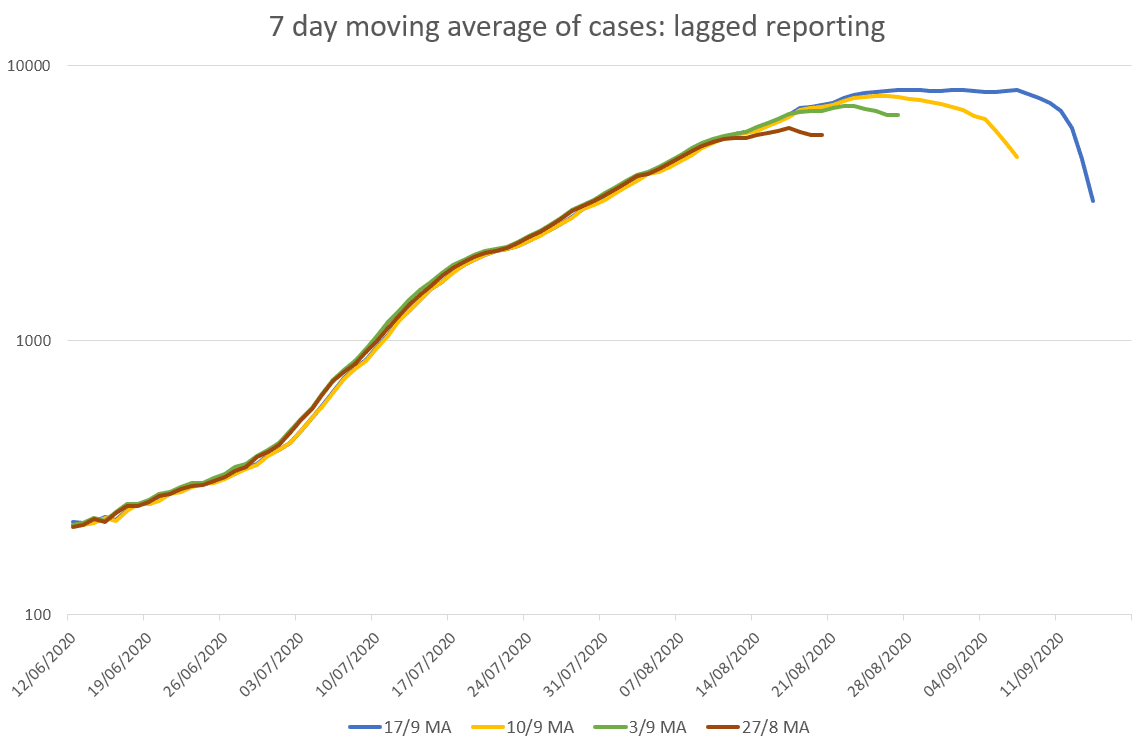
Figure 1
Cases
The 7 day average of daily cases in Spain hit a minimum of 214 on the 12th June, reaching a rate of around 8,000 per day by late August, as illustrated in Figure 2. We consider three phases in this recent data – relatively slow growth, followed by a rapid and briefly sustained increase, followed by a tailing off of the growth rate.
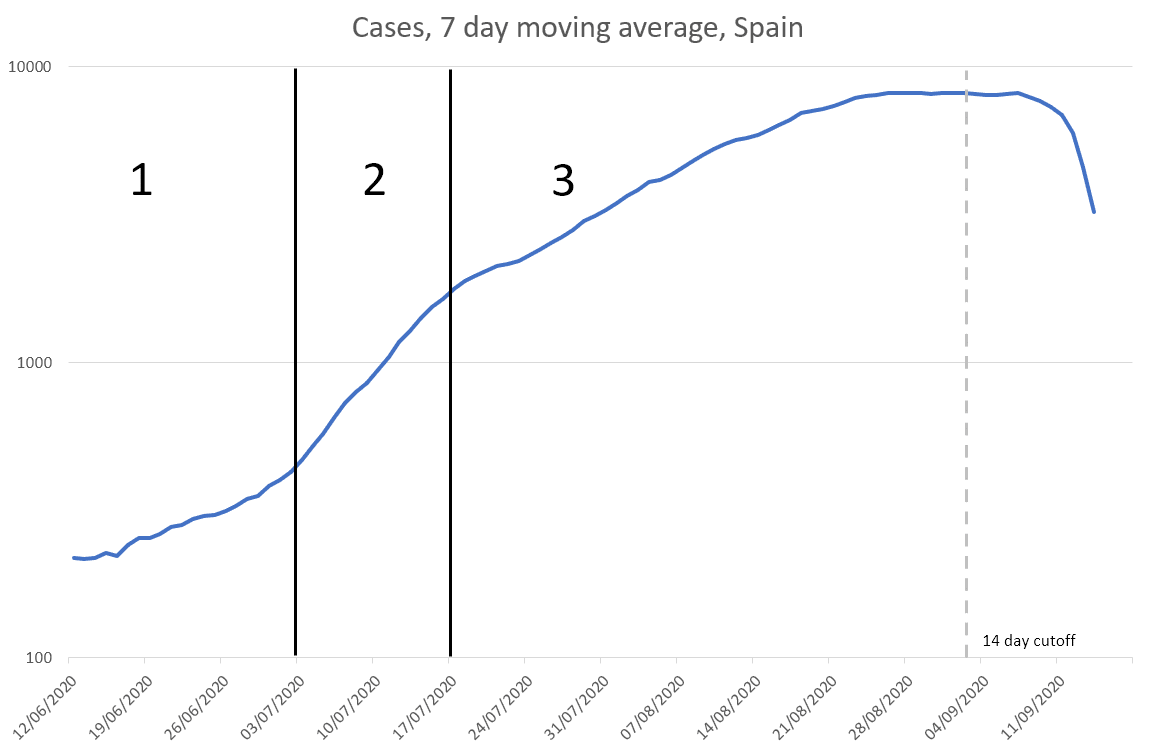
Figure 2
Phase 1 is characterised by relatively slow growth of cases, with a weekly growth rate that reached 1.40 by 2nd July. Case numbers subsequently exhibited a sharp rise – roughly linear on a log scale – approximately doubling every week in phase 2 in early to mid-July. Phase 3 from mid-July is, however, characterised by a decline in the weekly growth rate, which hit 0.99 as of our most recent reliable observation on 3 September. These changes in the weekly growth rate are shown in Table 1.
| Date |
Daily Cases (weekly moving average) |
Multiplicative growth |
| 19/06/2020 |
254 |
1.17 |
| 26/06/2020 |
315 |
1.24 |
| 02/07/2020 |
424 |
1.40 |
| 09/07/2020 |
849 |
2.00 |
| 16/07/2020 |
1637 |
1.93 |
| 23/07/2020 |
2199 |
1.34 |
| 30/07/2020 |
3127 |
1.42 |
| 06/08/2020 |
4298 |
1.37 |
| 13/08/2020 |
5755 |
1.34 |
| 20/08/2020 |
7211 |
1.25 |
| 27/08/2020 |
8156 |
1.13 |
| 03/09/2020 |
8101 |
0.99 |
Is this exponential growth?
It is worth examining what it means for cases to grow “exponentially”. Given the multiplicative nature of the growth of infectious disease, such growth at any point in time can only ever be exponential – the currently infectious number of people infecting new numbers of susceptible people.
True and sustained exponential growth, however, implies a stable multiplicative growth factor – this would be characterised by growth that appears as linear on a log scale, and a stable effective reproductive number (Re). While we observe something like such a relationship in phase 2, illustrated above, what we subsequently observe in phase 3 is a changing Re over time or a reduction in the average number of susceptible people infected by the currently infectious. Had the rate of growth of cases observed in phase 2 been maintained, the level of daily cases would have risen above 200,000 by early September.
While this data must be monitored for any potential increase in the reporting lag, it appears that the level of reported cases in Spain approached a plateau as of 3rd September, indicating no further such growth.
Deaths
We now apply methods used in previous articles to examine the relationship between reported cases and deaths in the Spanish data. As Spanish figures on cases report the date of symptomatic onset, we distribute cases as per Wood (2020)’s estimates of the lag from symptoms to death. Cases at risk and deaths are plotted in Figure 3.
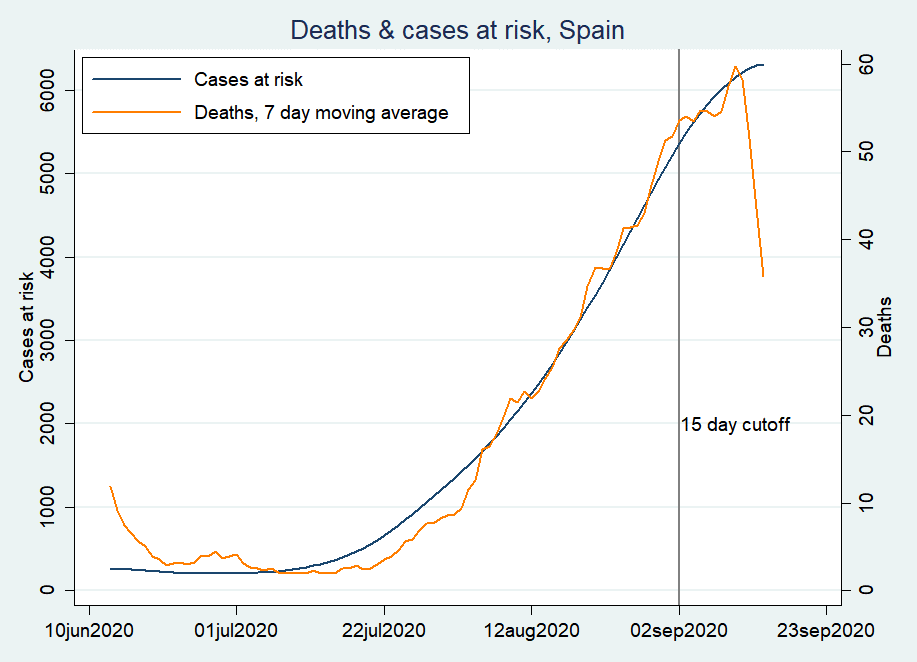
Figure 3
Unlike the UK data – which for many weeks displayed no relationship between the increase in cases and deaths – the number of cases at risk in Spain tracks the number of deaths. This suggests that – for the period that can be reliably observed so far – the number of cases has functioned as a reliable leading indicator of deaths. We will monitor this relationship over the coming weeks.
Daniel Howdon is a Senior Research Fellow in Health Economics, Leeds Institute of Health Sciences. Bio here
Jason Oke is a Senior Statistician at the Nuffield Department of Primary Care Health Sciences and Module Coordinator for Statistical Computing with R and Stata (EBHC Med Stats), and Introduction to Statistics for Health Care Research (EBHC), as part of the Evidence-Based Health Care Programme.
Carl Heneghan is Professor of Evidence-Based Medicine, Director of the Centre for Evidence-Based Medicine and Director of Studies for the Evidence-Based Health Care Programme. (Full bio and disclosure statement here)
Disclaimer: the article has not been peer-reviewed; it should not replace individual clinical judgement, and the sources cited should be checked. The views expressed in this commentary represent the views of the authors and not necessarily those of the host institution, the NHS, the NIHR, or the Department of Health and Social Care. The views are not a substitute for professional medical advice.