Epidemic curves organised by reporting date and specimen date.
September 21, 2020
Carl Heneghan, Tom Jefferson, Daniel Howdon, Jason Oke
We compare two ways to draw epidemic curves using current Spanish and England COVID-19 case data and show that one supports the idea of a continued growth in cases, the other shows initial rapid growth followed by a flattening of the curve. We consider the lack of clarity on the date of onset of symptoms in the data used in today’s briefing hinders meaningful interpretation.
Epidemic curves for COVID-19 can be constructed with numbers of cases by published date, or case numbers by the date that the specimen was taken, or in some cases by the date of symptom onset.
When there are delays in publishing test results the two curves can look different and lead to different interpretations.
In a press briefing today Professors Chris Whitty and Patrick Vallance showed epidemic curves for Spain and France, showing how cases numbers have been growing rapidly, possibly exponentially starting in August.
As is often done when using case numbers by publishing date, the raw numbers are smoothed with a seven-day moving average. Drawn this way, the data shows a continued upward trend.
Drawing the epidemic curve for Spain using cases by symptom onset produces a different result. We have put these two methods together on a single graph so that they can be compared.
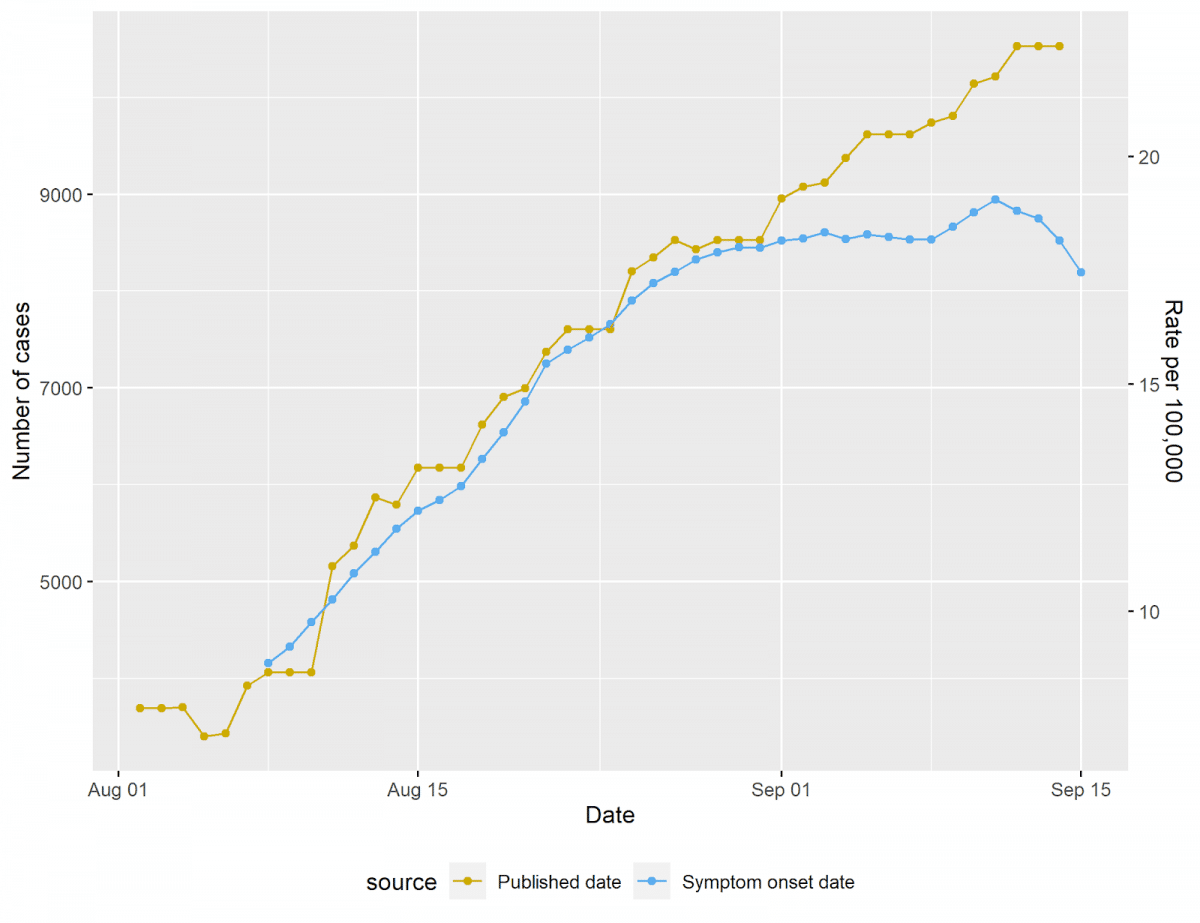
The epidemic curve based on the symptom onset date does not show the same continued growth and appears to show cases stalling starting in late August. As the majority of lag between the publishing date and symptom onset is between 1 day and two weeks, but in some cases longer, the most current data for the blue line will be revised upwards.
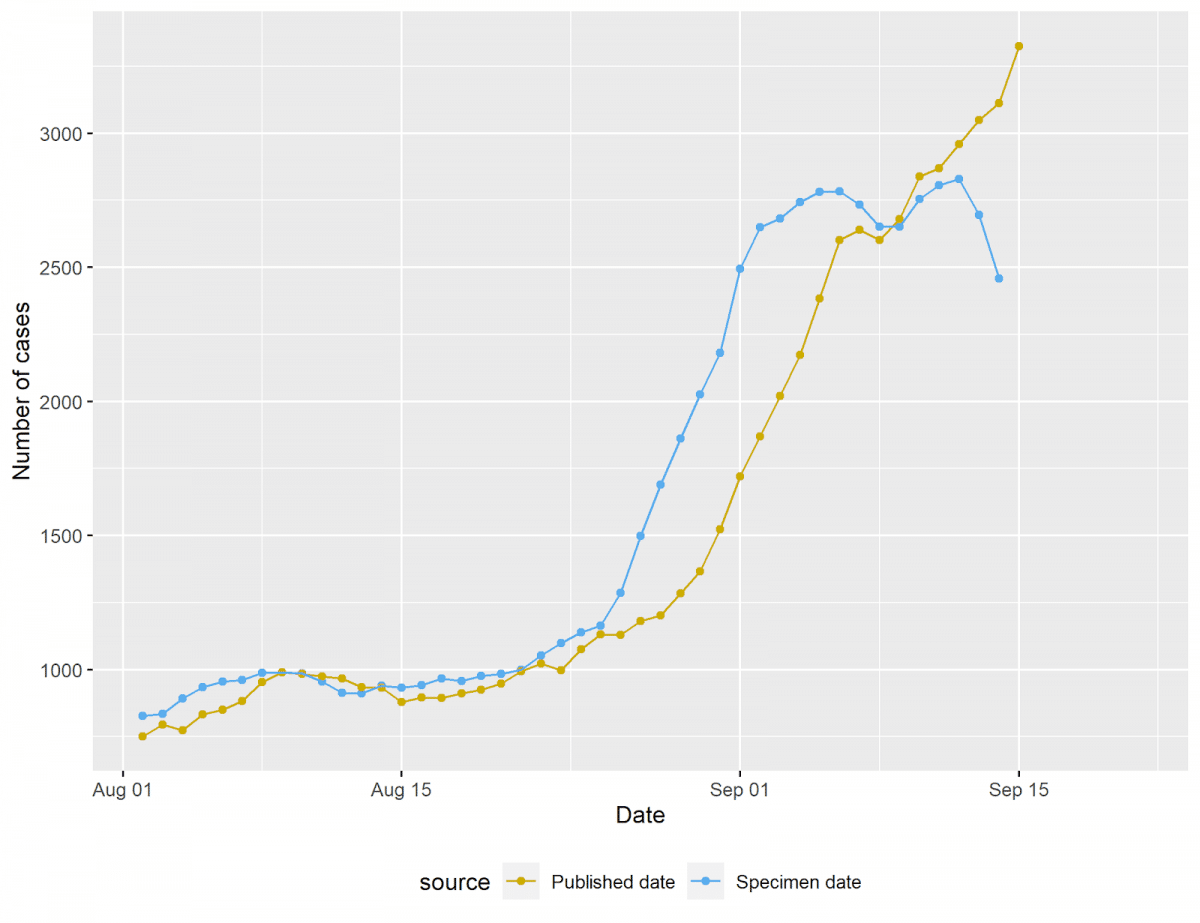
We repeated this for English case data, smoothing each series with a 7 day moving average. While the interpretation of recent case numbers in England is potentially complicated by well-documented problems with testing, we are able to replicate a similar pattern in cases by date of report and by date of specimen in English data.
We have previously shown that accounting for a potential two week lag in reporting, as of September 3, case numbers based on positive PCR tests appear to be flat in Spain. It, however, depends on which method of analysis you choose.
We consider the date of onset of symptoms availability is crucial to interpret the data. That is because in most cases the shedding of infectious virus is all but over after 7-10 days from infection and 5-7 days from onset of symptoms. In the most vulnerable shedding goes on for a lot longer (weeks). [1]
In addition, we have reported that Spain has three case definitions, one of which does not involve laboratory confirmation. We are not clear which definitions are being used in the Government’s brief and how comparable they are with the definitions used across the UK.
We will keep the data under review over the next few days and weeks to assess the changes in England data to observe whether cases are increasing or not, and what rate.
[1] Jefferson T, Spencer E, Brassey J, Heneghan C. Viral cultures for COVID-19 infectivity assessment. Systematic review. medRxiv. 2020:2020.08.04.20167932. Table 3
Daniel Howdon is a Senior Research Fellow in Health Economics, Leeds Institute of Health Sciences. Bio here
Jason Oke is a Senior Statistician at the Nuffield Department of Primary Care Health Sciences and Module Coordinator for Statistical Computing with R and Stata (EBHC Med Stats), and Introduction to Statistics for Health Care Research (EBHC), as part of the Evidence-Based Health Care Programme.
Tom Jefferson is an Epidemiologist. Disclosure statement is here
Carl Heneghan is Professor of Evidence-Based Medicine, Director of the Centre for Evidence-Based Medicine and Director of Studies for the Evidence-Based Health Care Programme. (Full bio and disclosure statement here)
Disclaimer: the article has not been peer-reviewed; it should not replace individual clinical judgement, and the sources cited should be checked. The views expressed in this commentary represent the views of the authors and not necessarily those of the host institution, the NHS, the NIHR, or the Department of Health and Social Care. The views are not a substitute for professional medical advice.