Reconciling COVID-19 death data in the UK
April 8, 2020
Jason Oke, Carl Heneghan
Lay Summary by Mandy Payne, Health Watch
How many people have died from COVID-19 in the UK? You’d think this was an easy question to answer, but you would be wrong. There are numerous places in which you can find this data, and they don’t always give the same answer.
See latest update: 15th April – COVID-19 Death Data in England
Sources:
Regular updates of COVID-19 cases and deaths globally and by individuals country are compiled by Johns Hopkins University, the World Health Organization (WHO) and the European Centre for Disease Prevention and Control (ECDC) to name but a few.
In England and the UK, there are three main sources of death data:
Data for England are combined with death counts provided to the Department of Health and Social Care – GOV.UK (DHSC) by the devolved administrations. These are published for the UK at 2 pm every day; Deaths outside NHS services are not included.
Reporting
The Public Health England dashboard (www.arccgis) extracts data at 5 pm each day and reports the following day, so numbers visible on the 8th April are current for the 7th of April.
NHS England releases data at 2 pm each day and reports daily count up to the previous day as well as a total figure.
The ONS mortality statistics are compiled from information supplied when deaths are certified and registered as part of civil registration and so released much later. This is because deaths can be registered five days after the death date (longer, if it is referred to a coroner for investigation).
As of the 31st March, the ONS issues a report every Tuesday, and their data includes cases from outside hospital and cases where COVID-19 is suspected, but no formal diagnostic test has taken place. ONS reports include data a week before the publish date and daily death numbers for the end of the previous week. Hence the report published on the 7th April included deaths up to the 27th March but also includes deaths registered by the 1st April.
The report includes daily counts that correspond to the PHE England data but also includes daily death data based on deaths registered by the same date but also daily data, including deaths registered five days later. For example, it reported (2020: week ending 27 March) 647 deaths for the 27th March for deaths registered by the 27th March but 1639 deaths for the 27th March using deaths registered by the 1st April. The latter figure is significantly larger because of the delay between the day of death and the registration date.
Revision.
What makes tracking up to date daily death data particularly tricky is that counts get revised daily. When the latest number of deaths are announced, numbers for all previous days are revised upwards with the most recent days often given the large adjustment.
For example, the NHS announced that a further 828 people, who tested positive for the Coronavirus (COVID-19) have died, bringing the total number of confirmed reported deaths in hospitals in England to 6,483 (April 8th). You might think that this means that 828 people died the day before, but this isn’t what is reported.
The data shows how the 828 deaths on the 8th of April are distributed amongst the previous days. (See here).
Table of the date of 828 deaths reported for the 8th April.
| Date |
Number of Deaths |
| 07-April 2020 |
135 |
| 06-April 2020 |
306 |
| 05-April 2020 |
162 |
| 04-April 2020 |
93 |
| 03-April 2020 |
63 |
| 02- April 2020 |
23 |
| 01-April 2020 |
17 |
| 31-March 2020 |
1 |
| : |
: |
| 04-March 2020 |
1 |
| Total |
828 |
Comparing sources.
Historical data for the UK can be extracted from the PHE dashboard but this will not match either the NHS data nor most of the ONS data. For example, compare the cumulative count of deaths for the 31st of March 2020.
| Source |
Count 27th March |
| Public Health England – Historical data |
679 |
| NHS England Statistics (as per 8th April report) |
1,710 |
| ONS by actual data registered by 1st April (published 7th April |
1,568 |
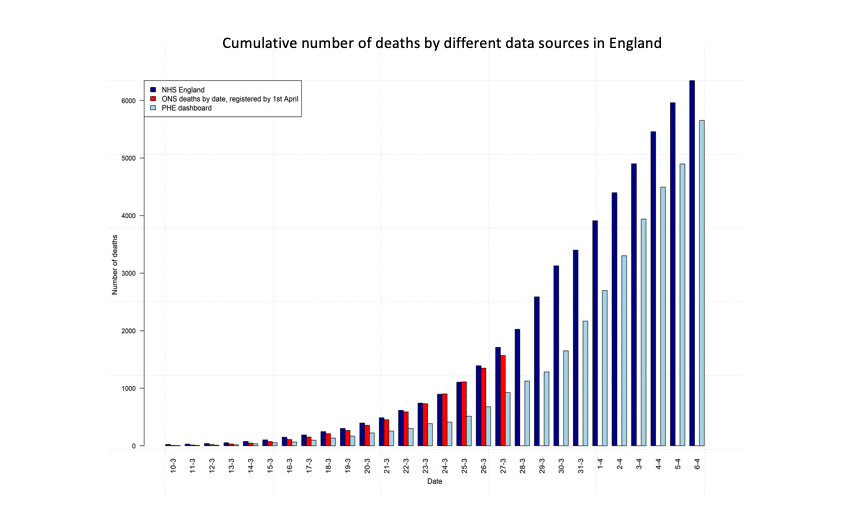
For the 27th March, the figures from the Public Health England dashboard severely underestimate the death figures for England. The most recent data from Public health England and NHS suggest the gap has narrowed considerably.
| Source |
April 7th |
| Public Health England (England) |
5,655 (reported on 8th April) |
| NHS England Statistics (as per 8th April report) |
6,347 |
| ONS by actual data registered by 1st April (published 7th April |
Not available |
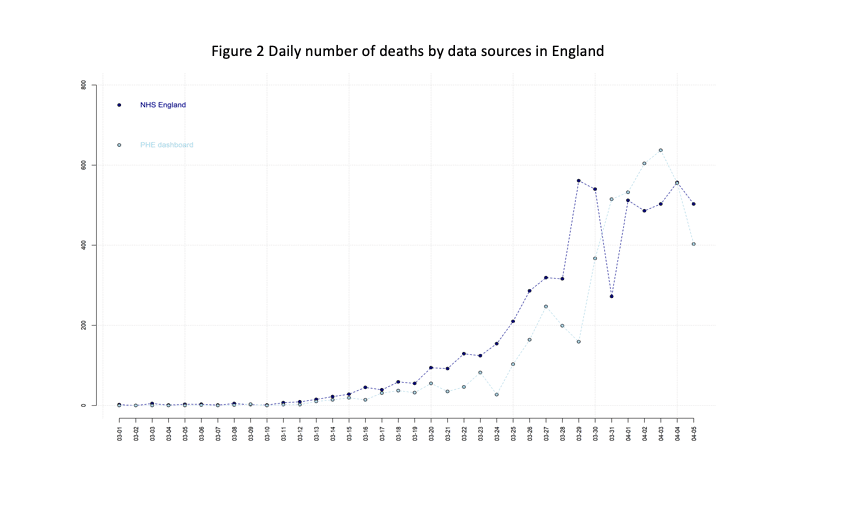
We have plotted ONS, PHE and NHS data over time to illustrate this.
Conclusion
Revising of previous counts makes it difficult to judge whether the deaths are falling over time in the short term. The media should be wary of reporting daily deaths without understanding the limitations and variations in different sources. We recommend NHS England and PHE prioritise the date of death, which will provide a better understanding of the peak deaths in the pandemic. The current data tentatively suggest a slowing in the rate of deaths and flatlining consistent with hitting a peak. However, inaccuracies in the data gives rise to considerable uncertainties.
See also:
and
AUTHORS
Jason Oke is a Senior Statistician at the Nuffield Department of Primary Care Health Sciences and Module Coordinator for Statistical Computing with R and Stata (EBHC Med Stats), and Introduction to Statistics for Health Care Research (EBHC), as part of the Evidence-Based Health Care Programme.
Carl Heneghan is Professor of Evidence-Based Medicine, Director of the Centre for Evidence-Based Medicine and Director of Studies for the Evidence-Based Health Care Programme. (Full bio and disclosure statement here)
Disclaimer: the article has not been peer-reviewed; it should not replace individual clinical judgement, and the sources cited should be checked. The views expressed in this commentary represent the views of the authors and not necessarily those of the host institution, the NHS, the NIHR, or the Department of Health and Social Care. The views are not a substitute for professional medical advice.